

NASDAQ-100
Why invest in the NASDAQ-100 with ATFX?
Customer Services
Tight Spreads
Effective Risk Management
Zero Commission
NASDAQ-100 Index Live
What is the Nasdaq 100 index?

The Nasdaq 100 index is composed of companies listed in the following sectors:
- Technology
- Industrial
- Retail
- Biotechnology
- Telecommunications
- Transportation
- Media
- Healthcare
- Services
The financial companies that fit the above classification are listed in a separate Nasdaq index known as the Nasdaq Financials-100. The Nasdaq-Financial-100 index tracks companies in the following sectors:
- Banking
- Insurance
- Brokerage
- Mortgage
The Nasdaq 100 index was launched in January 1985 by the National Association of Securities Dealers Automated Quotations. The index started as a subsidiary of the National Association of Securities Dealers (NASD), a self-regulating industry organisation that metamorphosed into the Financial Industry Regulatory Authority (FINRA).
The Nasdaq 100 index started with a baseline price of 250. It grew to 800 in December 1993 and had to be reset. Nasdaq 100 options were introduced on the Chicago Board Options Exchange (CBOE) in 1994. By 1998, foreign companies were admitted as American Depository Receipts (ADRs).
The Nasdaq 100 index has grown exponentially in value each year since 1985, except for the dot com bubble of 2000, followed by the 2001 – 2002 fallout from the September 11 terrorist attack, the 2008 global financial crisis, and the 2018 US-China trade war, being the only years in which the index closed lower than the previous year.
NASDAQ 100 Futures
What Are Nasdaq 100 Futures?
The Nasdaq 100 futures are contract-for-difference assets built to track the underlying Nasdaq 100 index price changes continuously. The Nasdaq 100 index futures track pre-market and after-hours trading and offer the investor an opportunity to trade the Nasdaq 100 index during and outside its official trading hours.
The Nasdaq 100 futures is a composite index that features the top 100 small-cap stocks within the technology, biotechnology and other non-financial sectors.
Trading on the Nasdaq 100 futures started on the Chicago Mercantile Exchange (CME) in 1996 at an initial value of 100 times the Nasdaq 100 index. This was followed shortly by the launch of the e-mini Nasdaq 100 futures, priced at 1/20th of the value of the Nasdaq 100 index. This action allowed for greater retail participation since the capital requirements for trading e-mini Nasdaq 100 futures were lower.
The contract size is $20 per contract and comes with a tick value of 0.25 points for every $5 move. The trading hours for this contract are 1700 hours to 1600 hours the next day.
Micro e-mini contracts are now available on some retail platforms.
Nasdaq 100 futures are leveraged contracts, meaning that the trader can hold a larger position with a percentage of the initial capital requirement for setting up the trade.
How to Invest in the Nasdaq 100 Like a Pro - 3 Simple Steps
Here are three simple steps to invest in the Nasdaq 100. These steps cover everything from setting up your trading portfolio to the trading process, after which you can cash out any earnings made.
Investing in the Nasdaq 100 index like a pro requires the following:
1. Selecting a suitable Nasdaq 100 broker
1.1. When selecting a suitable broker to trade the Nasdaq 100 like a pro, you want to open an account with a regulated broker that offers you a reasonable account opening minimum deposit. The broker should also give you contract sizes that do not force you to over-expose your account beyond the 3-5% maximum exposure limits.
One such broker is ATFX. ATFX offers a minimum spread of 2.5 points and a minimum trade size of 0.01 lots. The maximum lot size on the NAS100 index asset is 30 lots. The pip value per lot is $10, and you are assured of a 1:100 leverage on your positions.
2. Opening and funding a trading account
3. The trading process
3.1. The Nasdaq 100 futures are usually open for 23 hours a day, but there are times when the volatility is at its maximum. The most volatile times are usually in the first hour before the underlying Nasdaq 100 index opens for trading, the first hour of trading the underlying Nasdaq 100 index, and the last two hours before the market closes. Other opportunities arise shortly before/after a major news release, such as a Fed interest rate decision, the release of FOMC minutes, jobs or inflation data.
Socio-political and economic events during a particular period will determine what fundamentals are relevant to the Nasdaq 100. Understanding when the Nasdaq 100 is most active will enable you to hone your entry and exit strategies without spending too much time on the charts.
The Nasdaq 100 index accommodates all traders, but it is especially suited for day traders and scalpers. The Nasdaq 100 tends to make substantial moves, and the monetary values for its contract size (0.25 points = $5) can result in good profits or fast, heavy losses. It is not an asset for an undercapitalised retail trader to mess around with by taking unduly long swing or position trades. Market bias can change quickly, so let your capital and trading style realistically match your goals, using the Nasdaq 100’s behaviour as a guide.
Cashing out your earnings
A trader should not instantly cash out profits when they are made. Sometimes, a compounding plan may be the better option. For example, some traders may choose to operate two accounts: one for cashing out profits quickly and another for compounding trade profits to achieve bigger returns down the road.
If you choose the compounding option, there are calculators all over the internet that can show you how to go about it. In addition, some compounding strategies allow you to toy around with figures and make an allowance for cashing out a small percentage of profits. At the same time, the rest is reinvested with the original capital.
Is Nasdaq 100 a Good Investment?
Should you invest in Nasdaq 100? The answer is a resounding yes. Thankfully, there are good Nasdaq 100 brokers, and you will meet one of them at the end of the article.

Trading the Nasdaq 100 index is an excellent decision, especially in the current inflationary environment. The current situation of record-high global inflation is driving hawkish central bank action. The US Federal Reserve uses inflation and employment data as the basis for its monetary policy. Following the recovery of the US labour market (with evidence from the improving Non-Farm Payrolls and the falling Initial Jobless Claims data), the Fed began withdrawing (or “tapering”) its stimulus support programs to combat the worst effects of the COVID-19 pandemic in 2020. Worsening inflation from a cash-filled economy fueling overwhelming demand for goods and services that the current supplies cannot meet has driven US inflation to a 41-year high. The Fed’s response has been to raise interest rates, which could continue for some time.
The Fed’s actions will create once-in-a-lifetime trading opportunities on the Nasdaq 100 as it is susceptible to monetary policy changes and global risk sentiment.
3 Nasdaq 100 Trading Strategies You Need to Know
There are three Nasdaq 100 trading strategies you need to know.
- Intraday strategies
- News trading strategies
- Swing trade strategies
Many retail traders do intraday trading, and it is possible to day trade the Nasdaq 100 in this manner. There are many day trading strategies. Some of them use candlesticks, chart patterns and other methods like pivot points. The main aim of these strategies is to buy at a low price and sell at a higher price using specific predefined parameters.
News trading requires one to focus on using high-impact news releases on the economic news calendar to trade the Nasdaq 100 index. Some high-impact news affecting the Nasdaq 100 index include consumer inflation data, the Non-Farm Payrolls and speeches from Fed officials. The Fed’s interest rate decisions are also high-impact news, which generates significant volatility on the Nasdaq 100. You can trade the news by buying or selling the Nasdaq 100 futures based on whether the news is positive or negative. News trading requires access to the economic news calendar and a news feed that can stream the news and economic data releases as they become publicly available.
Swing trades involve holding on to open positions for several days. Swing trading involves holding a position on the Nasdaq 100 index beyond its daily market hours. Swing trading attracts fewer costs than day trading because you do not execute as many trades as a day trader, also known as portfolio turnover. But you pay rollover/swap fees for holding trades overnight. Your trades will also be more volatile because the market can sometimes gap up or down at the open, generating significant slippage. As a swing trader, you will also have to ride the waves created by various news releases, making your positions vulnerable to volatility, potentially leading to a considerable profit or a damaging loss.
Swing trading on the Nasdaq requires more capital to allow you to navigate the wild swings that the index undergoes daily. Most importantly, you need to know what you are doing since trading the Nasdaq is difficult. A bonus trading strategy based on identifying supply and demand zones is shown later in this article.
What is the Nasdaq 100 forecast for 2022?
The forecast for the Nasdaq 100 index is an attempt by analysts and traders to predict where the index will end up at the end of the year. It should be noted that while a forecast may point to certain levels, there will be a lot of volatility along the way and several up and down movements in the price action. However, the forecast will indicate the index’s trend and allow traders to take advantage of it.
So, where is the Nasdaq 100 headed in 2022? What is the Nasdaq 100’s long term forecast?
Two factors will determine the Nasdaq 100’s forecast for 2022:
- The US Federal Reserve’s Monetary policy
- Geopolitical factors
As far as monetary policy is concerned, 2022 will be the year of rate hikes. So far, the Fed has raised interest rates by 150 bps. Furthermore, many expected a 75 bps rate hike during the 28 July 2022 meeting, which happened but did not trigger an adverse market reaction.
Looking at the Nasdaq 100 long-term term chart again, you can see the steepest rise in the Nasdaq 100’s history between May 2020 and January 2022. The Fed’s decision to step in with the most extensive stimulus program in US history to prop up the economy in the face of the COVID-19 pandemic. Quantitative easing provided cheap money for investors to buy beaten-down stocks, and the Nasdaq 100 rose to new all-time highs. But having hit these highs, the index became overdue for a correction. The Fed’s decision to raise rates was the fundamental trigger for this correction, which is expected to continue throughout 2022.
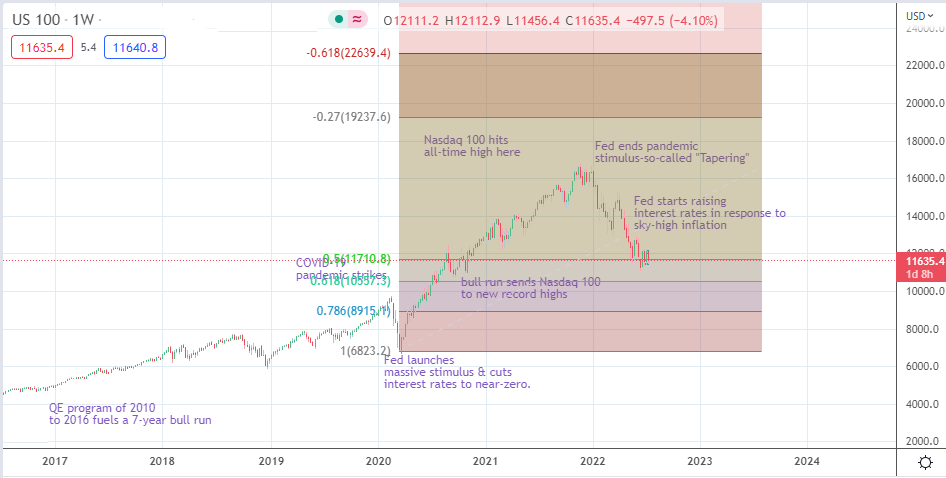
The chart above shows the Fibonacci retracements from the April 2020 swing low when the Fed started its stimulus program up to the January 2022 swing highs. The retracement phase of the price action is still ongoing, with the Nasdaq 100 currently testing the support provided by the 50% Fibonacci retracement level. Further rate hikes could send the Nasdaq 100 lower, with the 61.8% and 78.6% Fibonacci targets at 10057 and 8915, respectively, being the potential downside targets. Of course, many up-down swings will occur along the way, so traders should closely watch their trades and react quickly to changes in the underlying index. Traders should also use lower time frame charts to analyse the index.
Regarding geopolitics, the Russia-Ukraine conflict is expected to play a minor role in the Nasdaq 100’s price action. Instead, the effect will be exerted via the global economic outlook and predictions since many of the Nasdaq 100’s companies have a global presence. However, the biggest impact on the Nasdaq 100 will come from the Fed’s monetary policy actions.
The Nasdaq 100 index’s long-term forecast remains bullish. As can be seen from the index’s price action since 1985, the index has continued to rise over the long term despite several pullbacks occasioned by economic recessions.
Nasdaq 100 After hours
Nasdaq 100 Historical Data
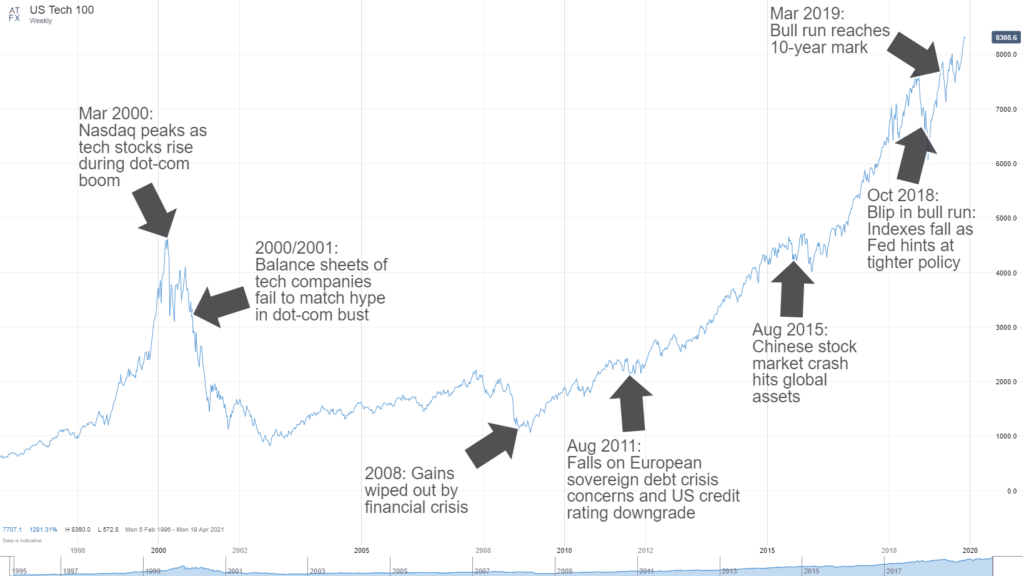
The snapshot above tells the story of how critical socio-political and economic events in the last 22 years have defined the value of the Nasdaq 100 index. Traditionally, any event that triggers falling interest rates is a Nasdaq-positive event. In contrast, conditions that bring about higher interest rates drive investment flows to money-market assets and are considered Nasdaq-negative.
You must understand these Nasdaq 100 market cycles as they are the key to making a ton of money from the index. Currently, we are in the cycle segment where the pandemic stimulus programs that flooded the economy with cheap money for investment and drove the Nasdaq 100 to new highs have ended. The QE programs have now been replaced with tighter monetary policy leading to higher interest rates, making money-market assets such as bonds more attractive to investors and stocks less attractive.
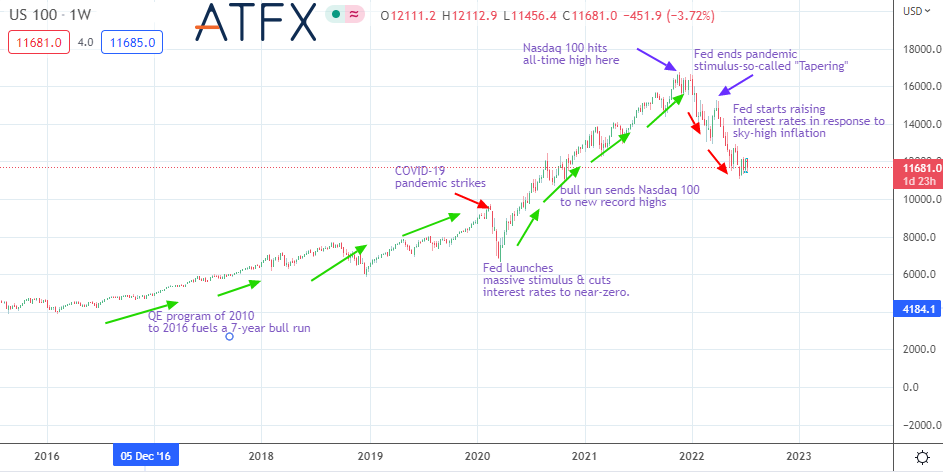
Nasdaq 100: Cycle of Events from 2016 to Date
The chart above is self-explanatory and shows, in a nutshell, the overriding fundamentals that drove the 7-year bull run from 2013 to 2020. It also highlights the COVID-19 pandemic hit of 2020, the 2-year massive bull run driven by cheap stimulus money, and the market’s reaction to monetary policy tightening by the Fed, which is where the market is at as of writing.
Nasdaq 100 Technical Analysis
Many Nasdaq 100 traders are either scalpers or day traders. Either way, the aim is to catch a move with as little drawdown as possible while targeting to make small profits that add up over time. As a result, day trading the Nasdaq 100 requires a spot-on identification of potential support and resistance areas. These are the demand and supply zones from which one can trade.
Here is a commonly used strategy for day trading the Nasdaq 100 index.
- The first step is identifying the demand and supply zones on the Nasdaq 100 chart. The most popular chart used by traders to do this is the 1-hour chart. Remember, this is intraday trading and the long-term charts, such as 4-hour and daily charts, are for swing trading.
- After identifying the demand and supply zones (more like support and resistance zones), you can aim to buy off the demand zone and sell on the supply zone using the 1-minute or 5-minute chart. Again, use filters to get entries that have a greater chance of success. For example, a divergence with the RSI or a candlestick reversal pattern with high probability usually works most times; however, if there is a high-impact news release, trade in the direction of the data.
- Always aim to risk not more than 3% of your account size on a single trade. That way, you will still have capital if your trade ends up a loser.
- Aim for realistic exits. Again, use filters that point to a reversal to exit your trade.
Here is an example of how this strategy could have played out on the Nasdaq.
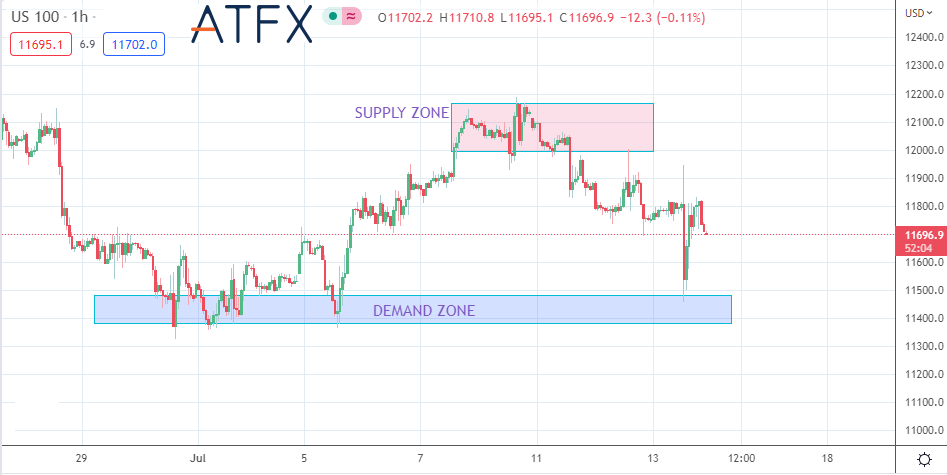
Nasdaq 100 1-hour Chart Showing Supply and Demand Zones
The 1-hour chart above shows the supply and demand zones for the Nasdaq 100 futures asset.
- The demand zone is where the price candlesticks form lows within a range of prices. This area is where the trader would seek to go long if the price action re-enters this zone in future.
- The supply zone is an area of price where the candles/bars form highs. The trader would seek to sell at this zone. Any other price push towards the same zone should trigger a sell, as highlighted above.
Having delineated the supply and demand zones, the next step is to drop down to the 5-minute chart. The US CPI report blew expectations out of the water on this day. Core CPI came in at 0.7%, up from the previous month’s 0.6% reading and higher than the market expectation of 0.5%. A higher-than-expected core CPI reading reinforced market expectations that the Fed would hike rates at its 28 July 2022 meeting. This is a Nasdaq-negative event, and the trader should be looking to sell.
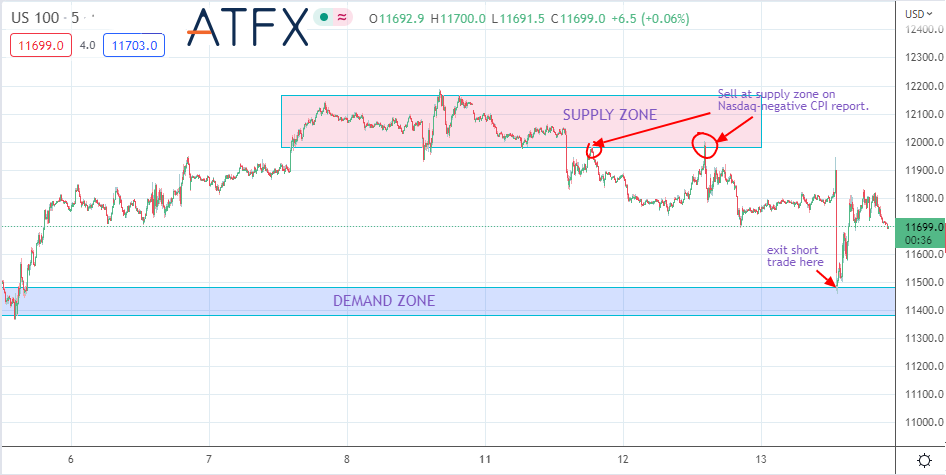
Nasdaq 100 5-minute Chart Showing Sell Entry Opportunities
Right on cue, the price stepped into the supply zone at 12,000, dropped to 11800 and went back into the supply zone for another selling opportunity. However, this time, the trade went all the way into the demand zone, with this area marking the end of the trade at 11500 for a 500-point move.
What are the criteria for companies to be listed on the Nasdaq 100?
The Nasdaq 100 provides four pathways (or rules) for companies that want to be listed. To qualify for Nasdaq listing, a company must fulfil at least one of the four requirements, in addition to the general listing rules for all companies.
General Listing Rules
- The bid price of the company’s shares must not go below $4. If the closing price is $2 or $3 and the company has at least three market makers for its stock, it could also qualify.
- Companies must have publicly traded outstanding shares of at least 1,250,000 at the time of listing. This does not include the ones held by key players in the company or any other shareholder that owns more than 10% of the company’s shares.
- The company must have at least 2,200 shareholders who own 100 shares or more or 500 shareholders who trade more than 1.1 million shares in annual trading volume.
- Companies must pay an application fee of between $5000 and $25,000, depending on the type of security and company size. In addition, a fee reflecting a percentage of the shares being issued may be charged.
- Companies must pay annual listing fees and other charges for activities such as filing and issuing additional shares.
Specific Listing Rules
Set 1: Earnings
The company must show evidence of pre-tax earnings of at least $11m in the past three years, or $2.2m in the past two years. In addition, it must have had no net loss in the three previous years.
Set 2: Capitalization + Cash Flow
- Aggregate cash flow of at least $27.5m in the past three years.
- No negative cash flow in that period.
- Market cap of $550m in the last year.
- Exemption for companies with an average market cap of $850m in the past year.
- Minimum of $110m in revenues in the past year.
Set 3: Capitalization + Revenue
If the company can prove a market cap of $850m in the past year, or $90m in revenue, it can qualify using this route.
Set 4: Equity + Assets
Total assets of at least $80m and shareholder equity of at least $55m can reduce market cap requirements to $160m for companies wishing to qualify for Nasdaq listing using the Set 4 route.
What is the difference between the Nasdaq 100 and the Nasdaq composite?
There is a difference between the Nasdaq 100 index and the Nasdaq Composite Index.
- Nasdaq 100: large-cap growth index that houses the 100 top domestic and international non-financial companies based on market cap.
- Nasdaq Composite: Comprises ALL of the Nasdaq’s domestic and international companies listed on the Nasdaq exchange, which comprises 3,700 stocks.
What moves the NASDAQ 100 index?
The Nasdaq 100 index is sensitive to global risk sentiment, Federal Reserve monetary policy, high-impact economic releases from China and the US, and geopolitical events. These are the primary drivers of the Nasdaq 100 index. Everything else that moves the index revolves around these primary drivers.
How is the NASDAQ 100 index calculated?
When and Why is the NASDAQ 100 rebalanced?
The Nasdaq 100 index undergoes rebalancing from time to time. This rebalancing process assigns new weighting standards for the index. Rebalancing the Nasdaq 100 index must account for events such as delistings. Furthermore, bankruptcy proceedings (which force regulators to stop all trading activities in the affected company), mergers and acquisitions and any other reasons that could impact the tradability of a listed stock.
Even though rebalancing is an annual event, the latest rebalancing was done on 29 April 2022. As a result, all Nasdaq 100 tracking assets had to cut their Apple holdings from 20% to 12% and raise their Microsoft weighting to 5%. The new weighting became effective on 2 May 2022.
Who should invest in the NASDAQ 100 index fund?
Investing in the Nasdaq 100 index fund is for those who want exposure to the Nasdaq 100 index in a manner that carries less market risk. For example, rather than investing directly by buying or selling the Nasdaq 100 index asset on a leveraged basis, you can decide to buy a stake in the Nasdaq 100 index fund as though you were buying the shares of a company.
Start investing in the NASDAQ 100 in 3 simple steps
Register for an account
Open your account
Complete the Live Trading Account application form. Once we have verified identity, we will set up your account.
Fund your account
Start trading
FAQ
It was created in 1985.
The technology stocks, especially the so-called FAANG stocks (Facebook, Amazon, Apple, Netflix and Google).
The exchange has a board that reviews applications and gives final approval to companies that meet the listing criteria.
The Nasdaq 100 index has 100 companies, while the Nasdaq Composite index has over 3,700 stocks.
The Nasdaq 100 has generated a compound annual growth rate of 14.74% over the past 36 years.
The Nasdaq 100 is managed by a board of directors that oversees its strategic direction, business performance and operations.
The Nasdaq 100 is managed by a board of directors that oversees its strategic direction, business performance and operations.
There is no limit to the index’s growth. Instead, it is a function of the level of demand that investors place on the component stocks over time.
The Nasdaq 100 opening hours are from 9:30 to 16:00 (EST) in New York.
No, the S&P 500 has its unique listing requirements.
Whether an index asset is overvalued or not depends on inherent fundamentals and other factors used to arrive at such determinations.
The value of the index is calculated by taking the closing price of each stock and multiplying it by a weighting factor. This is constantly recalculated to give the index’s value.
ATFX offers the Nasdaq 100 as a tradable asset.
The Nasdaq 100 index is not strictly a tech index since it features stocks from other sectors. However, the index’s weighting leans heavily towards technology stocks, which is why it is colloquially known as the tech index.
The best time to trade is during the market hours of the underlying index, especially in the final hour before the market opens, the first hour of market opening, and the last two hours of the market’s trading session.
It is susceptible to global risk sentiment and US monetary policy, which are the primary drivers of price movement as of writing. However, its volatility and leveraged trading status make it a suitable asset to trade.
The Nasdaq has only ever crashed when extreme market conditions, such as the Dot-com bubble of 2000, the September 11, 2001 attacks, the global financial crisis of September/October 2008 and March 2020 when the COVID-19 pandemic struck.
The Nasdaq 100 index is not a stock. Therefore, it does not pay dividends.
The Nasdaq 100 index is a market-cap weighted index.