USD/JPY Live Chart Analysis
In this article, you will learn all about the USDJPY exchange rate and how you can use technical analysis to enhance your trading capabilities and your trading results. In addition, we also cover the most frequently asked questions about the USD/JPY currency pair aspects.
USD JPY Live Chart
The USDJPY live exchange rate chart below shows how the USDJPY pair has performed over time. In addition, the chart can be used for technical analysis. Technical analysts use historical price levels and patterns to try and predict what will happen to the price in future. We will cover this in more detail later in the article.
What affects the USDJPY exchange rate?
If you would like to trade the Japanese Yen successfully, then you must be aware of the three main factors that affect the USDJPY exchange rate:
- Interest rate differentials
- Employment data (US Non-farm Payrolls)
- US Retail Sales data
1) Potential Interest Rate Changes
Interest rates represent the cost of borrowing money. But they are also the amount that the lender will earn from lending their money. For example, if you have money to invest, you can invest $100,000 with the US central bank at a 5% annual return. You also can invest the same amount of US dollars with the Japanese central bank at 1% per year. If there is no critical difference in the offering, you will invest the money with the US central bank, as you will get a higher return on your money.
Savvy investors might even borrow Japanese Yen for 1% in Japan, convert the JPY to USD, and invest the dollars in the US to earn 5% interest, which is called the carry trade and is the primary driver behind exchange rates. Because for people to invest their cheap Japanese Yen, they first have to convert them into the US Dollar.
What makes the USDJPY respond to interest rates is the expectation of change, not the change itself. The interest rate expectation refers to what investors expect the central banks to do when adjusting their interest rates. The Bank of Japan has kept interest rates steady for many years because the country has a deflationary economy. Furthermore, the export-oriented Japanese economy needs low-interest rates to make its currency weaker; hence, more attractive to importers of Japanese goods.
In contrast, the US economy has experienced strong economic growth and inflation over the last decade, forcing the US central bank, the Federal Reserve, to adjust its interest rates more frequently. Furthermore, interest rates have been higher in the US than in Japan.
The most recent interest rate adjustment by the Federal Reserve was on 16 March 2022, when the Fed raised interest rates in response to rising consumer inflation rates in the US.
For instance, traders and economists may predict that the US Federal Reserve will adjust interest rates higher or lower by a certain degree, say 25 basis points (or 0.25%). If the Fed meets this expectation, the USDJPY exchange rate change may not be as significant as if the Fed was to adjust interest rates by 50 bps or leave them unchanged. On the other hand, if the Fed exceeds or fails to meet the market’s expectations, the changes in the USDJPY exchange rate will be more significant.
2) Non-farm Payrolls (NFP)
The US Nonfarm Payrolls report is the monthly employment data from the US, which reveals the country’s employment change and unemployment rate. The USDJPY usually has a direct response to the non-farm payrolls. There must be a surprise in the economic data to produce a market reaction in the USDJPY pair. For example, suppose the employment change is greater than the market expectation. In that case, it must be followed by a fixed or lower unemployment rate to produce a greater change in the USDJPY currency pair.
On the other hand, suppose the employment change falls short of expectation. Then, a fixed or higher unemployment rate must follow to trigger a decline in the USDJPY exchange rate. The NFP report impacts the USDJPY exchange rate because the report has a high correlation to the US economy. In other words, if the US labour market is improving more than expected, it would suggest that the US economy is doing better than expected. Another reason why the NFP is important is that it is published monthly and at the beginning of the month. Meanwhile, more complete economic indicators, like the GDP, are published every quarter, with a delay.
3) Retail Sales
USDJPY Technical Analysis
USDJPY will trade sideways, which means the price oscillates between two price levels. However, the price typically trends in one direction when it is not oscillating. Experienced traders identify critical price levels known as support and resistance levels.
The first step for a beginner technical analyst is to analyse the USDJPY price trends. For example, ask yourself whether the price is stationary, or is it trending? Once you have determined the trend, you can then pick a suitable trading strategy.
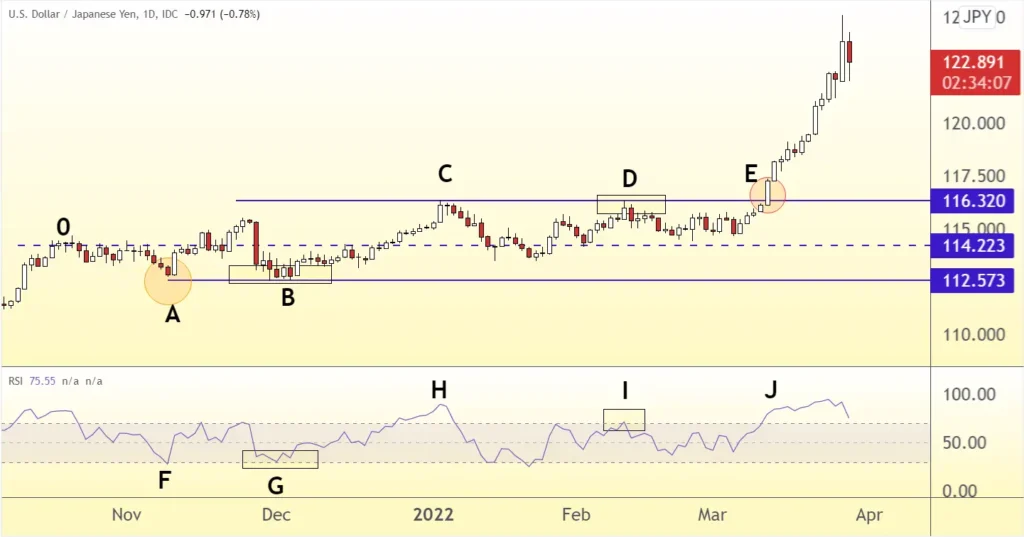
The USDJPY daily chart below shows that the price oscillated between the 112.57 support level and the 116.32 resistance level, followed by a trend on a break above the horizontal resistance level at 116.32 (point E).
USDJPY Daily Chart
The techniques when trading a range and a trend are different, some traders prefer range trading, and others prefer trends. However, the best traders have spent years honing their trading strategy to minimise losses and maximise gains. To help you get going, ATFX offers several trading education tools.
The example below will showcase a simple range trading strategy used when the price oscillates. First, we can see that the price is trading sideways from point 0 on October 19. However, this is not clear until November 29, when the price falls sharply.
From the chart, we can see that at point A, the USDJPY low from early November was hit again in early December at point B. So the general idea among technical analysts is that if people buy at point A, they will buy again at point B.
Adding the classic RSI indicator, seen in the lower panel of the chart at point G, we can see that the price is oversold once again. A range trader will therefore buy at point B and could hold the position until the price reaches the old November high, near point C. The trader could also have booked profits near the dotted line, which is the midpoint of the USDJPY range.
As the trader is not interested in trading against the trend, they would not short-sell at point C. Instead, they would wait until prices reached point D. We know that people sold at point C, so they will likely sell again when the price reaches the same level. In the lower panel, we can see that the RSI at point I is lower than at point H, indicating that the USDJPY pair could trade lower as the price later did.
Later at point E, the trader could try to short-sell again, but here the trader would have taken a loss, as the price breaks the highs at points C and D. Given that the price has been bottled up between 112.57 and 116.32, the price has struggled to trade back into the range and instead started trading higher. Trading this trend would require a different set of tools and indicators, like the MACD or other classic chart patterns.
How to improve trading success?
Technical analysis is one part of the equation used by successful USDJPY traders. Understanding the economic and political conditions in Japan and the USA, as explained above, are part of the fundamental analysis of the exchange rate. Most traders do not focus on the fundamentals as they may take months to reflect in the USDJPY’s price. However, everyone follows the general economic news flow to make better trading decisions. As an example, the break to point E in the chart above was probably inevitable at one point, as the Federal Reserve kept pushing for interest rate hikes, causing money to flow into the US dollar. Furthermore, Japan suffered an earthquake on March 16, a few days after the point E breakout, triggering speculation regarding fiscal stimulus. It also created another reason to sell the JPY and buy the US dollar.
USD JPY Historical Data
| USD JPY – Historical Annual Data | ||||||
|---|---|---|---|---|---|---|
| Year | Average Closing Price | Year Open | Year High | Year Low | Year Close | Annual % Change |
| 2023 | 139.98 | 130.73 | 151.69 | 127.90 | 148.35 | 13.14% |
| 2022 | 131.50 | 115.11 | 150.14 | 113.67 | 131.12 | 13.91% |
| 2021 | 109.84 | 103.24 | 115.42 | 102.72 | 115.11 | 11.49% |
| 2020 | 106.76 | 108.69 | 112.06 | 102.37 | 103.25 | -5.00% |
| 2019 | 109.01 | 109.69 | 112.08 | 105.28 | 108.68 | -0.89% |
| 2018 | 110.34 | 112.63 | 114.44 | 104.73 | 109.66 | -2.69% |
| 2017 | 112.15 | 117.55 | 117.75 | 107.84 | 112.69 | -3.65% |
| 2016 | 108.69 | 119.30 | 121.06 | 99.89 | 116.96 | -2.75% |
| 2015 | 121.05 | 120.20 | 125.58 | 116.78 | 120.27 | 0.35% |
| 2014 | 105.74 | 104.84 | 121.38 | 101.11 | 119.85 | 13.87% |
| 2013 | 97.60 | 87.10 | 105.25 | 86.92 | 105.25 | 21.48% |
| 2012 | 79.82 | 76.67 | 86.64 | 76.11 | 86.64 | 12.55% |
| 2011 | 79.70 | 81.56 | 85.26 | 75.72 | 76.98 | -5.74% |
| 2010 | 87.78 | 92.55 | 94.68 | 80.48 | 81.67 | -12.26% |
| 2009 | 93.68 | 91.12 | 100.71 | 86.12 | 93.08 | 2.52% |
| 2008 | 103.39 | 109.70 | 110.48 | 87.84 | 90.79 | -18.73% |
| 2007 | 117.76 | 118.83 | 124.09 | 108.17 | 111.71 | -6.14% |
| 2006 | 116.31 | 116.34 | 119.81 | 110.07 | 119.02 | 0.97% |
| 2005 | 110.11 | 102.83 | 120.93 | 102.26 | 117.88 | 14.80% |
| 2004 | 108.15 | 106.95 | 114.30 | 102.56 | 102.68 | -4.15% |
| 2003 | 115.94 | 119.86 | 121.42 | 106.93 | 107.13 | -9.79% |
| 2002 | 125.22 | 132.02 | 134.77 | 115.71 | 118.75 | -9.38% |
| 2001 | 121.57 | 114.73 | 131.47 | 114.26 | 131.04 | 14.60% |
| 2000 | 107.80 | 101.70 | 114.62 | 101.70 | 114.35 | 11.93% |
| 1999 | 113.73 | 112.15 | 124.45 | 101.53 | 102.16 | -9.66% |
| 1998 | 130.99 | 132.40 | 147.14 | 113.08 | 113.08 | -13.32% |
| 1997 | 121.06 | 115.49 | 131.08 | 111.42 | 130.45 | 12.68% |
| 1996 | 108.78 | 103.92 | 116.13 | 103.92 | 115.77 | 12.09% |
| 1995 | 93.96 | 100.52 | 104.20 | 81.12 | 103.28 | 3.69% |
| 1994 | 102.18 | 112.50 | 113.10 | 96.77 | 99.60 | -10.83% |
| 1993 | 111.08 | 125.40 | 126.10 | 101.10 | 111.70 | -10.53% |
| 1992 | 126.78 | 124.50 | 134.53 | 119.35 | 124.85 | -0.04% |
| 1991 | 134.59 | 134.60 | 141.90 | 124.90 | 124.90 | -7.99% |
| 1990 | 145.00 | 146.25 | 159.90 | 125.05 | 135.75 | -5.60% |
| 1989 | 138.07 | 123.60 | 149.62 | 123.60 | 143.80 | 14.99% |
| 1988 | 128.17 | 122.70 | 136.52 | 121.10 | 125.05 | 3.13% |
| 1987 | 144.60 | 158.25 | 159.40 | 121.25 | 121.25 | -23.40% |
| 1986 | 168.35 | 199.15 | 202.70 | 152.00 | 158.30 | -20.95% |
| 1985 | 238.47 | 251.80 | 262.80 | 200.25 | 200.25 | -20.41% |
| 1984 | 237.46 | 232.45 | 251.60 | 222.70 | 251.60 | 8.59% |
| 1983 | 237.55 | 232.00 | 247.05 | 226.75 | 231.70 | -1.28% |
| 1982 | 249.06 | 218.75 | 277.65 | 218.75 | 234.70 | 6.78% |
| 1981 | 220.63 | 202.50 | 246.10 | 199.05 | 219.80 | 8.22% |
| 1980 | 226.63 | 238.45 | 261.40 | 203.10 | 203.10 | -15.48% |
| 1979 | 219.02 | 194.58 | 250.85 | 194.58 | 240.30 | 23.67% |
| 1978 | 210.39 | 237.59 | 242.42 | 177.05 | 194.30 | -19.03% |
| 1977 | 268.62 | 292.48 | 292.91 | 237.81 | 239.98 | -18.12% |
| 1976 | 296.45 | 305.06 | 306.00 | 286.04 | 293.08 | -3.96% |
| 1975 | 296.78 | 300.66 | 306.84 | 284.66 | 305.16 | 1.38% |
| 1974 | 291.84 | 280.82 | 305.34 | 274.42 | 301.02 | 7.40% |
| 1973 | 271.31 | 301.39 | 302.57 | 254.45 | 280.27 | -7.09% |
| 1972 | 303.13 | 314.86 | 314.96 | 294.12 | 301.66 | -4.24% |
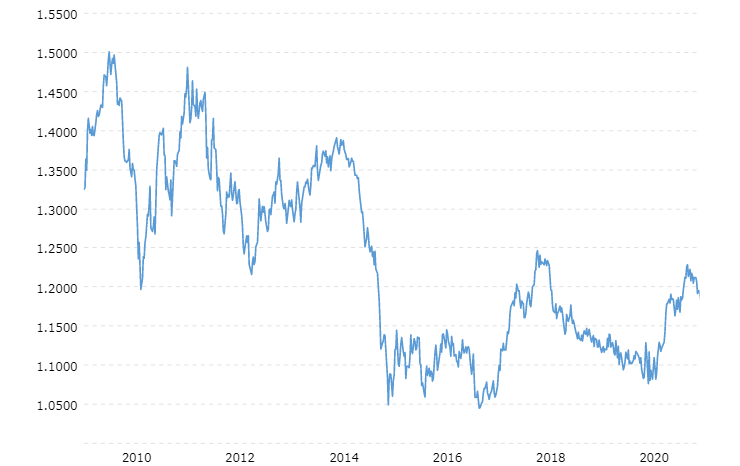
The USDJPY historical price chart shows the USDJPY exchange rate history that dates back nearly a decade. The evolution of the USDJPY exchange rate helps traders study the behaviour of this currency pair at specific points in time. In addition, several significant events have taken place globally that shook the currency markets.
In 2008, the collapse of the US subprime mortgage market triggered the global financial crisis. The crisis affected all three primary triggers that influence the USDJPY exchange rate. First, most central banks adjusted interest rates to record lows as each central bank launched its unique versions of quantitative easing to get their economies back on track. The manufacturing and employment sectors were also affected, and the crisis’ impact on consumer spending power was profound. Finally, the global economy largely recovered a few years later, only for the COVID-19 pandemic in 2020 to cause a more profound upheaval in the global financial markets. As the world tries to navigate the global pandemic, a study of the USDJPY exchange rate at all these notable points in history can give traders an idea of how the USDJPY tends to behave in response to specific market news and events.
You can use the data in the table above to understand what years had the best and worst performance. You may also check if the exchange rate has cyclical or other price patterns with predictive values. For instance, we can see that the USDJPY was trading at less than 80.00 in 2012, one of the Yen’s strongest performances. At that time, the US economy was still grappling with the 2008 global economic meltdown. In addition, the Fed’s QE program was yet to be fully implemented. By 2016, the USD JPY was trading around 125.00 due to the Fed’s QE program having the desired effect on the US economy and attracting investment flows back into the US. The US economy was also getting a boost from shale oil production, allowing it to become a net exporter of crude oil for the first time. Japan has no crude oil reserves and is a net crude oil importer. Therefore, after the US became a net oil exporter, the dollar strengthened against the weaker yen.
The collapse of oil prices from 2017 to 2020 made shale oil too expensive to produce. Hence, this nullified the US Dollar’s advantage over the Yen from that angle. In 2020, the US Fed Reserve cut interest rates to near-zero after the onset of the COVID-19 pandemic. The USD JPY fell into a consolidation range since there was no divergence in interest rates between the two countries and has primarily traded sideways since then.
So, if a trader wants to know what conditions push the USDJPY higher or lower, looking at the historical charts and understanding what was going on would help shape their investment focus.
USDJPY Pip Value
The USDJPY pip value simply means the monetary value of a unit change in the USDJPY exchange rate. A PIP (or Percentage Interest Point) is the smallest unit of measurement of the change in the exchange rate of a currency pair. A pip is equivalent to 0.0001 points.
Until 2010, the pricing of the exchange rate of most currency pairs was to four decimal places, while those of Yen pairings were to two decimal places. Nowadays, brokers price Yen pairs to three decimals, with the last decimal valued at 1/10th of a pip.
As the exchange rate changes on a pip-by-pip basis, every trader must know how this translates into money made or lost from a trade.
The more money you commit to a trade, the higher the pip value. Suppose you enter into a transaction involving the USDJPY pair. In that case, you should know the matching profit or loss potential of your financial exposure. If the investment capital you commit into a USDJPY trade gives the pip a value of $9.80, be sure that every time the exchange rate changes, it does so for $9.80 per pip. If the price moves 20 pips against you, the position will be negative 9.8 X 20 = $196. If the exchange rate moves in your favour by 30 pips, you will gain 9.8 X 30 = $294.
Knowing the USDJPY pip value will give you some awareness of how much you potentially stand to gain or lose per trade. With this information, you can adjust your risk exposure levels accordingly so that a single loss does not significantly deplete your trading capital.
How to calculate the pip value of the USDJPY pair
A standard lot is worth 100,000 units of currency. This figure is derived by multiplying the size of the contract by the number of points that constitute a pip. So a standard lot for the USDJPY = (100,000 x 0.01pips) = 1,000 JPY.
The value of a pip in USD is obtained by dividing the pip value in JPY by the current exchange rate. For example, at the time of writing, the exchange rate for the USDJPY is 122.06; hence, 1,000/122.06 = 8.19 USD.
Therefore, a standard lot of the USDJPY pair is worth 1,000 Yen or 8.1926 USD.
To get the pip value for a mini-lot or micro-lot, refer to the first calculation where you multiply the size of the contract (10,000 for mini-lot or 1,000 for micro-lot) by 0.01. This gives 100 JPY for a mini-lot (0.81 USD) or 10JPY (0.081 USD).
Calculating Profit and Loss on the USDJPY
Now that we know the value of one pip of the USDJPY pair, the next step is to see how this pip value translates into profits or losses in actual trades.
- If the trader buys the USDJPY at 122.10 and the pair’s exchange rate rises to 122.30, the trade has won 20 pips. The USD equivalent of the profit is 20 X 8.1926 = $163.852.
- If the same trade had closed at 121.10, the trade would have lost 100 pips, and the position would lose 100 X 8.1926 = -$819.26.
USDJPY trading hours

Please note that there is a difference between the USDJPY trading hours and the trading sessions where the USDJPY pair is most active.
The USDJPY currency pair features two currencies whose continents of origin are North America and Asia. Therefore, you would expect more significant activity on this pair in the New York time zone and the Tokyo time zone. However, the Tokyo time zone is not as volatile as the New York time zone. Even banks in Japan wait until the London trading session to conduct business.
However, the hours where the New York and London time zones overlap have the busiest trade activity as it is when US economic data is published. This is when the USDJPY pair experiences its greatest volatility. The trading volumes outside these hours are thin, and volatility is low.
How to trade or invest in the USDJPY like a pro - 3 simple steps
A. Create a Functional Trading Strategy
If you trade the USDJPY pair in 2022, you must have a working trading strategy. A forex trading strategy that works for one month and stops working for the next three months will not help. You can use a demo account to track the performance of your trading strategy. Or you can use a real account but trade with smaller lot sizes for the same purposes.
An effective trading strategy to trade foreign currencies introduces an element of discipline into the trader’s work. It ensures that the trader only enters the trade when predefined parameters are met. It also tells the trader when to exit a position on the trading platform. If you develop a strategy that works or have one you can copy as part of a copy-trading subscription, you will have better chances of succeeding than someone who trades without a solid strategy. Forex brokers like ATFX offer a significant amount of trading education and tools like the ATFX support and resistance indicator to help you succeed.
Creating a strategy starts with defining the strategy’s parameters and testing it on a demo account before graduating to a low-capital real money account. If the strategy survives the scrutiny of a real money account, you can deploy it to a larger account.
B. Risk Management
Even the best strategies will incur losses occasionally, which is where risk management comes in. Risk management prevents your losses from being colossal and irreparably damaging your account. First, determine how much you can risk per trade without losing much of your trading capital if you encounter a losing streak. Most professional traders agree that you should risk no more than 2-3% of your account capital on any trade. Such an approach protects your trading capital over the long term.
C. Stick to One System
Stick to one strategy and master it thoroughly by trading it frequently. Do not fall into the trap of watching online videos of traders making thousands of dollars per day using a holy grail strategy. The best strategy will not work in the hands of someone who does not know how to implement its parameters skillfully. So instead of jumping from one strategy to another, it is better to take a profitable strategy and work on it to see how best you can adapt it to your situation.

Why trade USD JPY with ATFX?
Competitive Spreads
24/5 Forex Trading
Trade 40+ Currency Pairs
Zero Commission
FAQ
The USD JPY is a currency pair that pits the United States Dollar against the Japanese Yen.
We do not speak of one currency pair being worth more than another in forex. But in terms of trading volumes, only the EURUSD and GBPUSD attract more daily trading volume than the USDJPY.
The EURUSD and EURGBP pairs have a positive correlation with the USDJPY pair. But their correlations keep changing over time.
The USDJPY positively correlates with most Yen pairs, such as the GBPJPY and EURJPY pairs.
The USDJPY is open for trading from 17.00 EST on Sunday and stays open until Friday at 17.00 EST.
USDJPY trade signals are trade alerts that tell a trader when to enter a buy or sell position on the USDJPY pair and when to exit the trade. These parameters are usually set before the trade signal is sent to the trader.
The USDJPY market volatility is the slowest outside of the market overlap hours of the London and New York time zones and the overlap between the Asian and London time zones. Between 21:00 GMT and the Tokyo opening at 00:00 GMT is the slowest time for the USDJPY pair. Another drop in volatility occurs between 03:00 and 05:00 GMT when Tokyo winds down and London opens. Avoid trading the USDJPY pair at these times.
The recent charts of the USDJPY indicate that the pair is trending upwards. This is because the Federal Reserve has begun raising interest rates and has indicated that there are more rate hikes to come in 2022. Higher interest rates in the US make USD-denominated instruments such as US Treasuries more attractive, which increases demand for US dollars as investment money flows into the US. Therefore, the USD JPY is expected to keep trending higher.
The highest recorded USDJPY exchange rate of 147.67 occurred on 11 August 1998 at the height of the Japanese banking crisis.
To calculate the position size for the USDJPY pair, you should ensure it is not more than 3% of your total trading account capital. You must also know the pip value of the USDJPY for your position, the stop loss you want to set for the trade, and the leverage offered by your broker. Assuming your capital is $5,000, you should aim to risk no more than 3% of this amount, which is $150. The leverage of 1:30 is the European/UK standard offering. This means that for every $30 offered by your broker, you are to commit $1 as margin collateral. If you put up the entire $150 as margin collateral, it gives you thirty times this amount as buying power, which is 150 X 30 = $4500.
A mini-lot of USD JPY is 10,000 units of currency. 10,000 units divided by 4500 = 2.22. This means you would be able to buy 2.22 mini-lots with $150 (3% of your account size). At the same time, the pip value of 2.22 mini lots is:
- 81926 (see calculation under USD JPY pip value) X 2.22 = 1.8188 USD.
- Therefore, the maximum stop loss you can set for the position is 150/1.8188 = 81.47 pips.
So the position size for a $5000 account on the USD JPY should not exceed 2.22 mini lots (0.22 lots) with a stop loss of 82 pips. Please note that this is the maximum allowable position size and stop loss which does not break risk management principles. Of course, you are free to step down your numbers to give you more protection.
The forex market opens for trading at 17.00 EST on Sunday evening and closes for trading at 17.00EST on Friday.
Volatility charts for the USD JPY have shown that the best time to trade the USD JPY is between 12.00 and 15.00 GMT, when the London and New York market hours overlap.
The USDJPY and gold have a negative correlation, but this is conditional. When there is a global market upheaval, there is a flight to safe-haven assets such as gold and the US Dollar. At this time, you may see the USDJPY rising, and gold (XAU/USD) also rising.