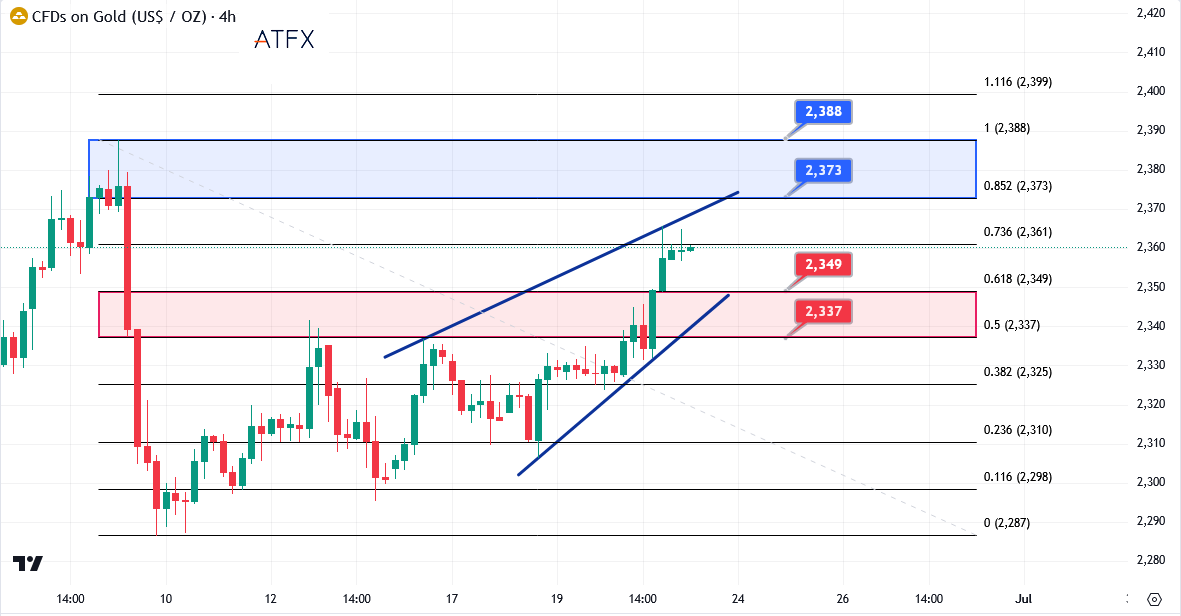
Gold prices advanced sharply by more than 1% on Thursday during the North American session as US Treasury bond yields advanced to underpin the Greenback. Data from the United States was softer than expected, boosting traders’ confidence that the Federal Reserve (Fed) will ease policy at least twice in 2024.

GOLD 4-hour chart
The XAU/USD trades at $2,356 at the time of writing.
The latest economic data from the US continued to show that the economy is decelerating, prompting investors to price in two 25-basis-point (bps) interest rate cuts. A worse-than-expected US jobs report revealed that Americans filing for unemployment benefits rose above estimates.
US housing data disappoints markets as building permits and housing starts have cooled.
In the meantime, Minneapolis Fed President Neel Kashkari stated it will likely take a year or two to bring core inflation down to 2%. He added that the trajectory of interest rates would depend on the economic conditions, emphasising, “We are achieving disinflation despite remarkable economic growth.”
Rising geopolitical risks helped the golden metal uptrend. Tensions in the Middle East are rising as Israel threatens to launch an attack on Hezbollah in Lebanon. That, along with the recently signed pact between Russia and North Korea, could increase the appeal of the yellow metal, trading near a crucial resistance level.
The CME FedWatch Tool shows that the odds for a 25 bps rate cut for September are 58%, down from 62% a day ago. In the meantime, the December 2024 Fed funds futures contract implies the Fed will cut 36 bps toward the end of the year.
Market movers
- US Dollar Index prints gains of 0.405, up at 105.64, a headwind for Gold prices.
- US Treasury bond yields jumped, and 10-year Treasury note yield is up more than four basis points to 4.257%.
- US Initial Jobless Claims for the week ending June 15 rose to 238K, exceeding estimates of 235K but lower than the previous reading of 243K.
- US Building Permits declined by 3.6% in May, dropping from 1.44 million to 1.386 million. Housing Starts for the same period fell by 5.5%, from 1.352 million to 1.277 million.
- Fed officials counselled patience on interest rate cuts and emphasised they would remain data-dependent. Although last week’s CPI report was positive, policymakers reiterated that they need to see more reports like May’s data.
- Despite the US CPI report showing that the disinflation process continues, Fed Chair Jerome Powell commented that they remain “less confident” about the progress on inflation.
Technical analysis
Gold buyers are testing the Head-and-Shoulders pattern, dragging the golden metal above the pattern’s neckline. A daily close above the latter’s confluence and the 50-day Simple Moving Averages (SMA) at around $2,343 could negate the bearish chart pattern and open the door for further gains.
In that event, Gold could extend its gains above $2,350, exposing additional key resistance levels. Next would be the June 7 cycle high of $2,387, ahead of challenging the $2,400 figure.
Conversely, if XAU/USD drops below $2,343, that would keep the Head-and-Shoulders chart pattern intact, and Gold could be headed to the downside. If XAU/USD slides drop below $2,300, the next support would be the May 3 low of $2,277, followed by the March 21 high of $2,222. Further losses lie underneath, with sellers eyeing the Head-and-Shoulders chart pattern objective from $2,170 to $2,160.


