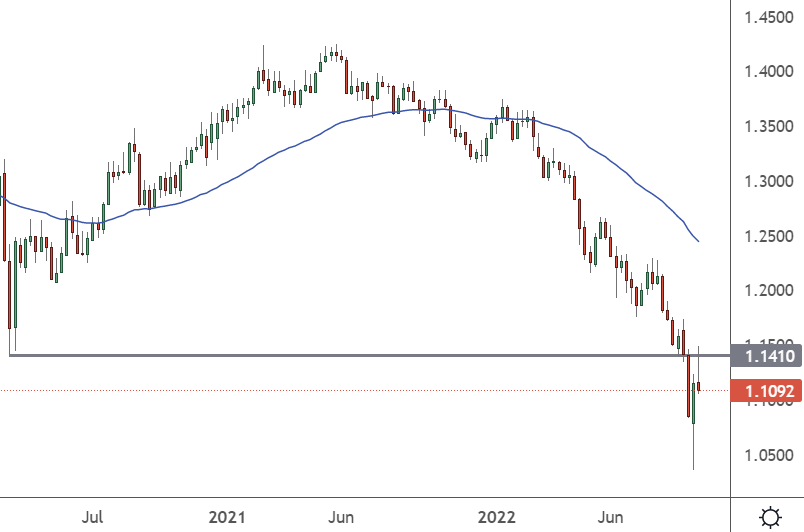
The GBPUSD pair bounced recently after the UK government’s U-turn on tax cuts.
In the week ahead, we have many data releases from the United States and Great Britain.
GBPUSD – Weekly Chart

The weekly chart shows a line in the sand at the 1.1410 level in the GBPUSD. After a small rejection, we may go back to the downside or break higher, which will be data-dependent.
The first economic data for the week is UK employment on Tuesday, with the market forecasting a -127k loss of jobs in the country after the previous month’s 40k gain. Despite the losses, the unemployment rate is forecast to remain at 3.6%.
The following day brings the latest GDP growth figures for the United Kingdom, with a -0.2% dip expected for the three months into the end of August.
Later we will get the first US data of the week, which could be significant with PPI numbers, followed by the FOMC minutes of the latest Federal Reserve meeting.
After Friday’s better jobs, markets have backed off on their imminent pivot expectations from the central bank. A further 75-basis point hike is now expected, with some even considering 100-basis points if Thursday’s inflation figures are high. Last month saw an 8.3% increase from the 8.1% forecast, and now we get the same estimates for September.
Friday completes the busy day week with retail sales for the US and Michigan consumer sentiment. Retail sales are expected to dip to 0.2% from 0.3% as consumers feel the pinch.
The data from Tuesday will be the most important, and traders should expect volatility. If Fed rate hike expectations reduce, the pound can vault through the recent resistance. However, that will also depend first on the British employment and growth figures.


