S&P 500
This article will discuss crucial elements of investing and trading the S&P 500 index. We will cover the basics of the S&P 500, the performance of the S&P 500 index over time, the differences between the S&P 500 index and S&P 500 index futures and other related topics.
Why trade & invest in the S&P 500 with ATFX?
Customer Services
Tight Spreads
Effective Risk Management
Zero Commission
S&P 500 Index Live
S&P 500 Futures
At a glance, both charts appear to have no difference. But in reality, the differences become more apparent when you switch to a bar chart or a candlestick chart. The S&P 500 index chart chronicles the price movements of the underlying market during the active trading hours. The underlying index is open for trading from 9.30 am to 4 pm Eastern US time, except for holidays and weekends. Outside of these hours, the price activity on the index will not reflect on the live charts. However, when the underlying market opens, the price activity aligns with the S&P 500 futures, and price gaps will be seen on the live chart.
In contrast, the S&P 500 futures chart showcases the index’s CFD asset price activity. It is a 23-hour/day market with price activity reflected on the charts continuously even when the live market is closed.
Traders need to note this difference because any price divergence between the S&P 500 index chart and the S&P 500 futures chart will correct in the direction of the futures asset when the live market opens for trading.
How to trade & invest in S&P 500 in 3 Easy Steps
Here are three easy steps to investing in the S&P 500. First, you can trade the US500 CFD futures asset directly on the ATFX trading platform. Other methods include buying an S&P 500 index fund, which generally appears to carry less risk but delivers minimal returns to make your investment worthwhile, especially if you do not have much money.
Follow the steps below to open a S&P 500 CFD trading account on ATFX.
- Create an account by filling out the online account opening form and submitting your identification and residency documents for verification.
- Fund the account using one of the available payment options
- Trade
1. Account Opening
1.1. The first step, irrespective of how you want to invest in the S&P 500, is to open a brokerage account. This means you should take time to do some research as to which broker will offer you trading conditions that suit your investment goals.
2. Account Funding
2.1. The S&P 500 index is a volatile asset, and the margin requirements surpass those of FX trading. Therefore, you must fund your account and ensure it is well capitalised to handle the index’s volatility. If you trade with a broker like ATFX, you can control the impact of price swings by trading fractions of the S&P 500 contract.
3. Trading
3.1. Trading involves buying an index fund that tracks the S&P 500 or using long and short orders to capture profits from the market direction by trading the S&P 500 leveraged CFD product. When trading the S&P 500 index, you must have a profitable strategy and apply proper risk management.
Why Invest in the S&P 500 CFD Asset? 3 Advantages You Should Know About!
- It is a passive investment
- Such funds are suitable for long-term investment
- The funds tend to be profitable over time
1.1. Trading the S&P 500 index CFD asset ensures you have access to an evergreen investment vehicle that provides near-continuous trading opportunities. For example, the COVID-19 pandemic saw a collapse in many other investments, but not the S&P 500 index CFD asset, which remained as vibrant as ever, if not more. In addition, due to the bi-directional nature of the S&P 500 index, there are many opportunities to profit when it is falling and rising.
2. Great for Long Term Investment2.1. Following the previous section, the S&P 500’s consistent return over time makes investing in the S&P 500 index an excellent investment vehicle for long-term investors. Over time, the value of the S&P 500 index tends to rise. Trends in the S&P 500 index can last a long time. Therefore, even if you decide to buy the S&P 500 index CFD when the markets have fallen, you still stand a chance to make profits over the long haul, provided you apply proper risk management rules to protect your account from a massive drawdown.
3. Potential for Larger Profits Over Time3.1. Since 2000, the S&P 500 index has gained 307.32%. A $1,000 investment into an S&P 500 index fund in 2000 would have yielded nearly $4073.2 in 2022. However, trading the S&P 500 index, CFD can deliver returns of 300% to 500% a year if the trader uses a dynamic strategy and proper risk management.
A CFD asset allows the trader to go long or short and take advantage of rising and falling prices. So, how is it possible for S&P 500 CFD trading to deliver potential returns of 300% a year, instead of 300% over 20 years like the main index delivered? Let us use a simple compounding formula, which assumes that the trader will trade the S&P 500 index CFD for 250 days out of 300 trading days in a year, with a starting capital of $1,000. The trades will seek to make 1% gains daily, reinvesting and compounding 50% of all daily gains made and receiving the rest of the percentage gain as a monetary payout.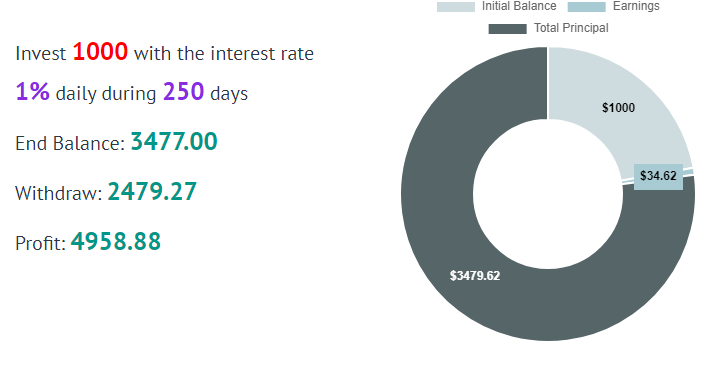
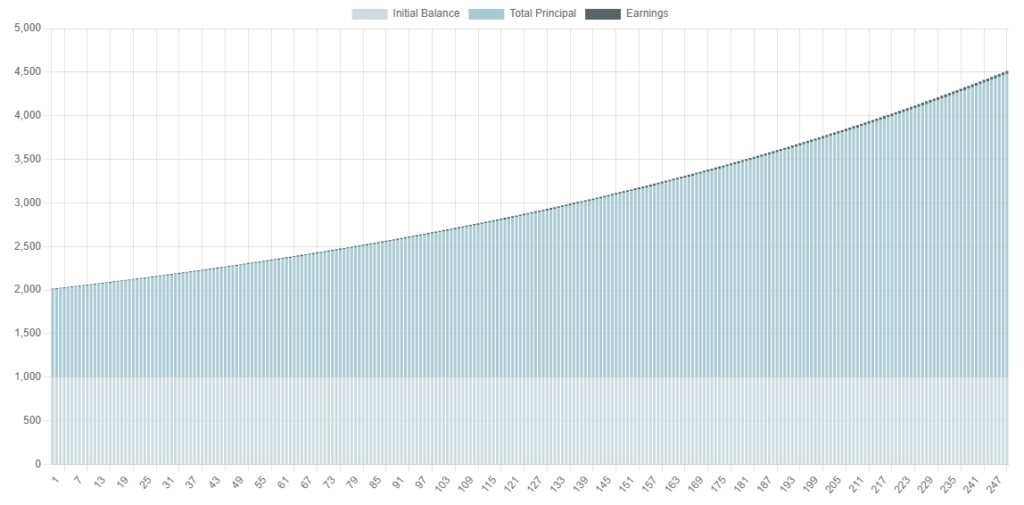
The snapshot shows the trader would have grown their capital from $1,000 to $3,479, with a total cash withdrawal of $2,479.27 and a net profit of $4,958.88. These figures indicate that it is possible to make 300% to 500% returns on the S&P 500 CFD index product, using an incredibly conservative risk amount and a strategy that delivers a 1% return daily. This calculation factors in that the trader will miss some trading days (50 days out of a 300-day trading year) and will have days where multiple winners and losers will deliver a 1% return together.

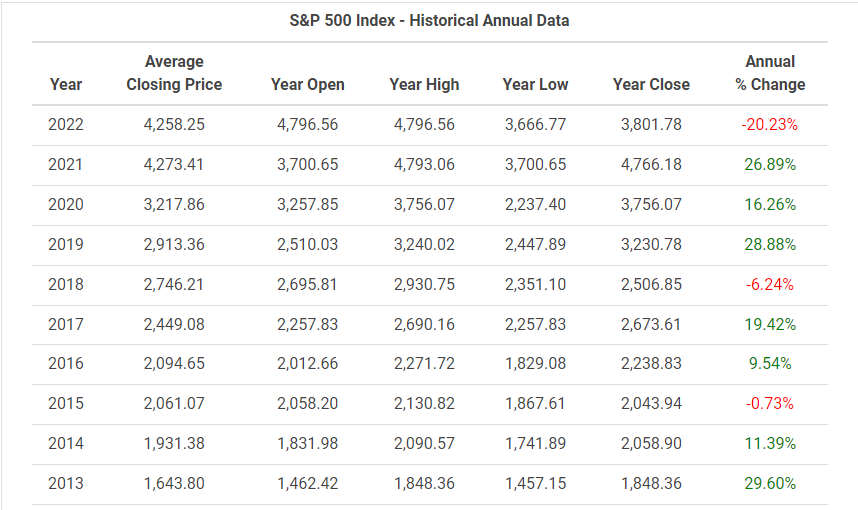
The S&P 500 Average Annual Return
What is the historical average annual return of the S&P 500 index? As we have mentioned earlier, the average annual return is 6.44%. Suppose the trader uses leveraged CFD products to trade the underlying S&P 500 index. Trading leveraged S&P 500 index CFDs also allows you to profit from dips in return and can become significantly larger.
S&P 500 Historical Returns by Year
Why do investors use the S&P 500 as a benchmark?
The S&P 500 index is used as a benchmark for the market’s performance because the market capitalization of the listed companies is more than 4/5ths of the entire US stock market. Therefore, it gives an accurate picture of how the overall market is performing. The S&P 500 index also makes it easy to purchase assets that emulate it, giving one exposure to a diversified pool of stocks.
Research has shown that buying into the S&P 500 will eventually outperform an active portfolio manager who picks large-cap stocks.
What is the S&P 500, and What Does it Measure?
What are the Top 10 companies on the S&P 500 in 2022?
Top 10 companies in the S&P 500 index as of 2022:
- Apple Inc
- Microsoft Corp
- Amazon.com Inc
- Tesla Inc
- Alphabet Inc Class A (GOOGL)
- Alphabet Inc. Class C (GOOG)
- Nvidia Corp
- Berkshire Hathaway Inc.
- Meta Platforms Inc (formerly Facebook)
- UnitedHealth Group Inc
Start investing in the S&P 500 in 3 simple steps
Register for an account
Open your account
Complete the Live Trading Account application form. Once we have verified identity, we will set up your account.
Fund your account
Start trading
FAQ
The best time to invest in the S&P 500 is when it has undergone a correction from its recent highs. This gives you a better entry price since you will buy it much cheaper than at its highs.
The S&P 500 index asset, traded as an index fund or ETF, delivers profitable returns over time with less risk than trading individual stocks. Furthermore, the index fund exposes you to a basket of assets, which reduces the risk of trading an individual stock and gives a single point of failure if the stock price plunges.
The value of the S&P 500 index will also drop significantly if the top 10 stocks are affected.
The S&P 500 index was created in 1957.
The S&P 500 has several symbols, including US500, SPX500 or SP500.
If you are a long-term investor, one can dollar cost average, that is, buy a fixed amount of stock monthly. When the index falls, one can increase the amount bought. As long as the US economy continues to grow in the long run, the S&P 500 is expected to do well.
You can use any of the many momentum indicators, such as the Relative Strength Index (RSI), to determine when the S&P 500 index is overbought (i.e. between 70-100 for the RSI).