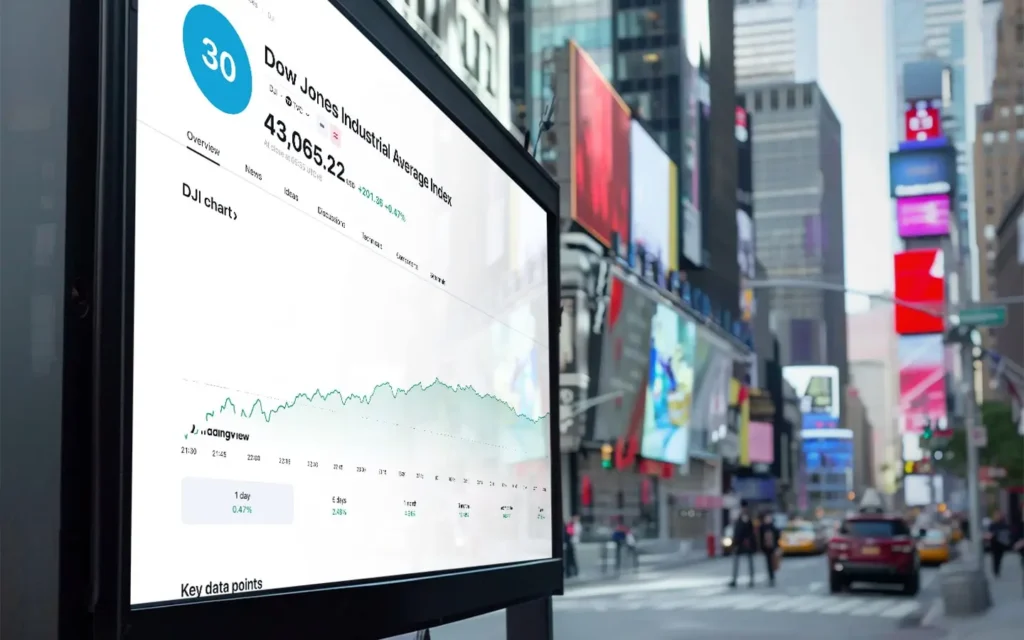
Dow Jones
This page investigates the Dow Jones history and provides an outlook into the Dow Jones future, what it comprises and the advantages of trading the Dow with ATFX. We will also unravel trade opportunities provided by the DJIA in the past. Furthermore, through analysing the Dow Jones Live Charts, we can examine different trading strategies that can be used to trade the Dow Jones today. Finally, the FAQs section answers the most frequent questions traders have regarding the Dow and how to trade it with a CFD broker.
Why Trade the Dow Jones?
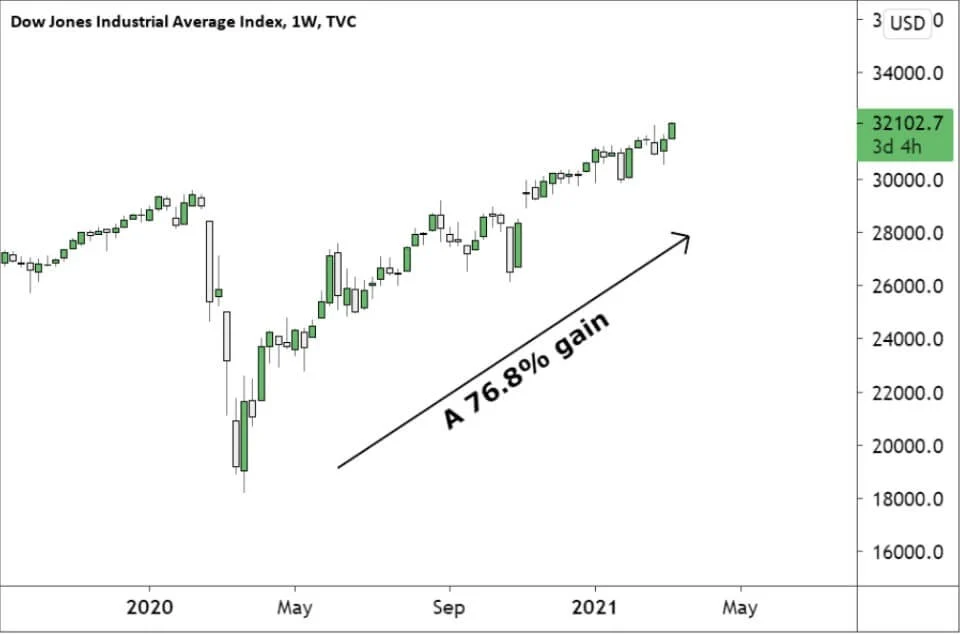
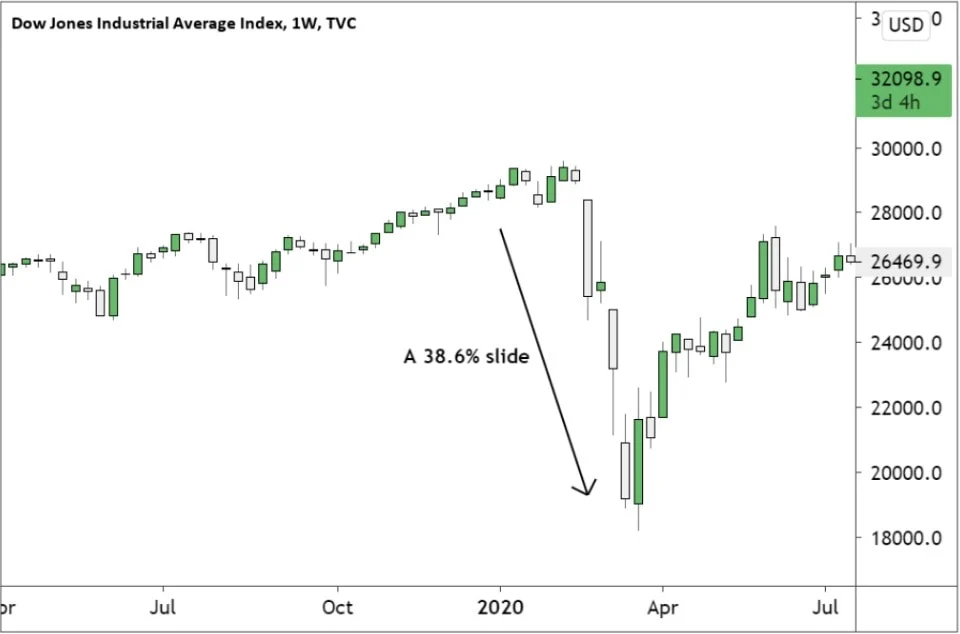
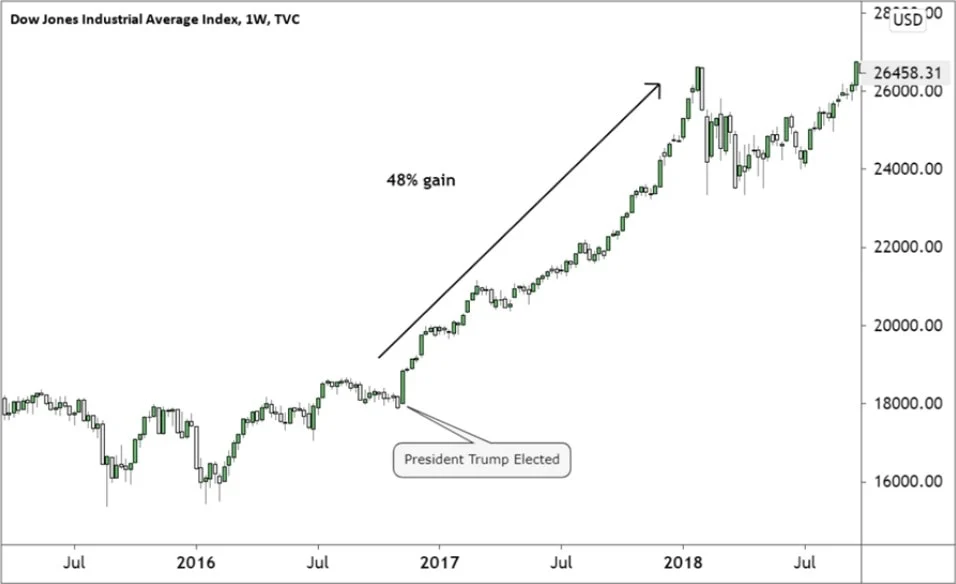
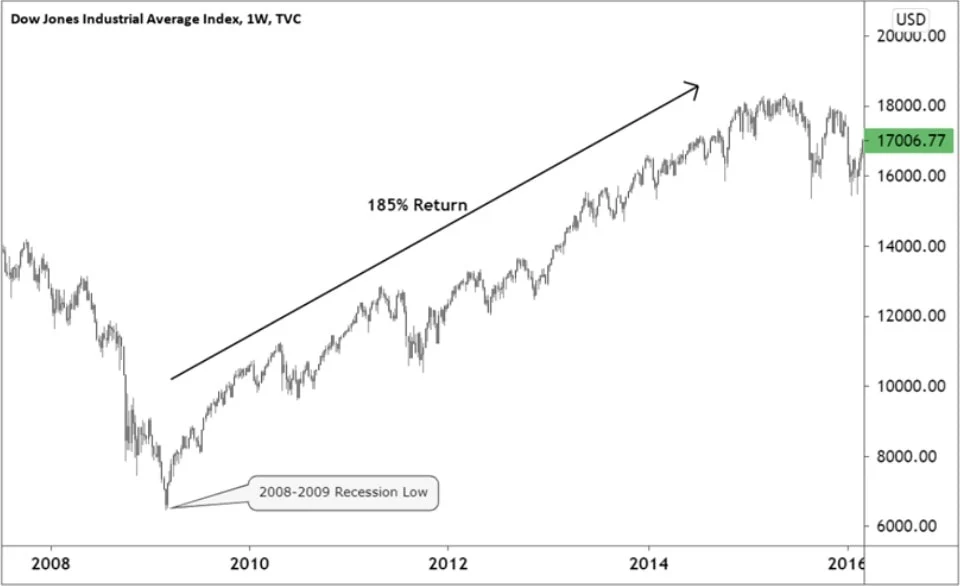
Notable price changes in the Dow Jones
The election of President Donald Trump in December 2016 triggered an unexpected 48% rally in the Dow during the two years.
Advantages of Trading with ATFX
Low Spreads
Always Online
All Major Markets
No Commission
What is the Dow Jones Index?
History of Dow Jones Industrial Average

The Dow Jones was initially composed of 12 of the largest industrial companies in the United States operating in the tobacco, cotton, railroad, gas, sugar and oil sectors. The index then expanded to include 30 of the largest US corporations by 1928. Since then, the index has changed multiple times, as some companies were dropped from the index and replaced by others. Thus, while many investors regard the Dow as a reliable indicator of the health of the US economy, there are others with a different opinion, given that the biggest firms all have significant revenues from outside the U.S.A.
| Dow Jones Industrial Average – Historical Annual Data | ||||||
|---|---|---|---|---|---|---|
| Year | Average Closing Price | Year Open | Year High | Year Low | Year Close | Annual % Change |
| 2024 | 37,555.37 | 37,715.04 | 37,863.80 | 37,266.67 | 37,863.80 | 0.46% |
| 2023 | 34,121.54 | 33,136.37 | 37,710.10 | 31,819.14 | 37,689.54 | 13.70% |
| 2022 | 32,898.34 | 36,585.06 | 36,799.65 | 28,725.51 | 33,147.25 | -8.78% |
| 2021 | 34,055.29 | 30,223.89 | 36,488.63 | 29,982.62 | 36,338.30 | 18.73% |
| 2020 | 26,890.67 | 28,868.80 | 30,606.48 | 18,591.93 | 30,606.48 | 7.25% |
| 2019 | 26,379.59 | 23,346.24 | 28,645.26 | 22,686.22 | 28,538.44 | 22.34% |
| 2018 | 25,046.86 | 24,824.01 | 26,828.39 | 21,792.20 | 23,327.46 | -5.63% |
| 2017 | 21,750.20 | 19,881.76 | 24,837.51 | 19,732.40 | 24,719.22 | 25.08% |
| 2016 | 17,927.11 | 17,148.94 | 19,974.62 | 15,660.18 | 19,762.60 | 13.42% |
| 2015 | 17,587.03 | 17,832.99 | 18,312.39 | 15,666.44 | 17,425.03 | -2.23% |
| 2014 | 16,777.69 | 16,441.35 | 18,053.71 | 15,372.80 | 17,823.07 | 7.52% |
| 2013 | 15,009.52 | 13,412.55 | 16,576.66 | 13,328.85 | 16,576.66 | 26.50% |
| 2012 | 12,966.44 | 12,397.38 | 13,610.15 | 12,101.46 | 13,104.14 | 7.26% |
| 2011 | 11,957.57 | 11,670.75 | 12,810.54 | 10,655.30 | 12,217.56 | 5.53% |
| 2010 | 10,668.58 | 10,583.96 | 11,585.38 | 9,686.48 | 11,577.51 | 11.02% |
| 2009 | 8,885.65 | 9,034.69 | 10,548.51 | 6,547.05 | 10,428.05 | 18.82% |
| 2008 | 11,244.06 | 13,043.96 | 13,058.20 | 7,552.29 | 8,776.39 | -33.84% |
| 2007 | 13,178.26 | 12,474.52 | 14,164.53 | 12,050.41 | 13,264.82 | 6.43% |
| 2006 | 11,409.78 | 10,847.41 | 12,510.57 | 10,667.39 | 12,463.15 | 16.29% |
| 2005 | 10,546.66 | 10,729.43 | 10,940.55 | 10,012.36 | 10,717.50 | -0.61% |
| 2004 | 10,315.51 | 10,409.85 | 10,854.54 | 9,749.99 | 10,783.01 | 3.15% |
| 2003 | 9,006.64 | 8,607.52 | 10,453.92 | 7,524.06 | 10,453.92 | 25.32% |
| 2002 | 9,214.85 | 10,073.40 | 10,635.25 | 7,286.27 | 8,341.63 | -16.76% |
| 2001 | 10,199.29 | 10,646.15 | 11,337.92 | 8,235.81 | 10,021.57 | -7.10% |
| 2000 | 10,729.38 | 11,357.51 | 11,722.98 | 9,796.03 | 10,787.99 | -6.17% |
| 1999 | 10,481.56 | 9,184.27 | 11,497.12 | 9,120.67 | 11,497.12 | 25.22% |
| 1998 | 8,630.76 | 7,965.00 | 9,374.27 | 7,539.07 | 9,181.43 | 16.10% |
| 1997 | 7,447.01 | 6,442.49 | 8,259.30 | 6,391.70 | 7,908.30 | 22.64% |
| 1996 | 5,739.63 | 5,177.45 | 6,560.91 | 5,032.94 | 6,448.27 | 26.01% |
| 1995 | 4,494.28 | 3,838.48 | 5,216.47 | 3,832.08 | 5,117.12 | 33.45% |
| 1994 | 3,794.22 | 3,756.60 | 3,978.36 | 3,593.35 | 3,834.44 | 2.14% |
| 1993 | 3,524.92 | 3,309.20 | 3,794.33 | 3,242.00 | 3,754.09 | 13.72% |
| 1992 | 3,284.08 | 3,172.40 | 3,413.20 | 3,136.60 | 3,301.11 | 4.17% |
| 1991 | 2,929.04 | 2,610.64 | 3,168.83 | 2,470.30 | 3,168.83 | 20.32% |
| 1990 | 2,679.45 | 2,810.15 | 2,999.75 | 2,365.10 | 2,633.66 | -4.34% |
| 1989 | 2,510.33 | 2,144.64 | 2,791.41 | 2,144.64 | 2,753.20 | 26.96% |
| 1988 | 2,061.48 | 2,015.25 | 2,183.50 | 1,879.14 | 2,168.57 | 11.85% |
| 1987 | 2,277.53 | 1,927.31 | 2,722.42 | 1,738.74 | 1,938.83 | 2.26% |
| 1986 | 1,793.10 | 1,537.73 | 1,955.57 | 1,502.29 | 1,895.95 | 22.58% |
| 1985 | 1,327.99 | 1,198.87 | 1,553.10 | 1,184.96 | 1,546.67 | 27.66% |
| 1984 | 1,178.59 | 1,252.74 | 1,286.64 | 1,086.57 | 1,211.57 | -3.74% |
| 1983 | 1,190.78 | 1,027.04 | 1,287.20 | 1,027.04 | 1,258.64 | 20.27% |
| 1982 | 884.53 | 882.52 | 1,070.55 | 776.92 | 1,046.54 | 19.60% |
| 1981 | 932.95 | 972.78 | 1,024.05 | 824.01 | 875.00 | -9.23% |
| 1980 | 891.14 | 824.57 | 1,000.17 | 759.13 | 963.99 | 14.93% |
| 1979 | 844.38 | 811.42 | 897.61 | 796.67 | 838.74 | 4.19% |
| 1978 | 821.13 | 817.74 | 907.74 | 742.12 | 805.01 | -3.15% |
| 1977 | 894.37 | 999.75 | 999.75 | 800.85 | 831.17 | -17.27% |
| 1976 | 975.20 | 858.71 | 1,014.79 | 858.71 | 1,004.65 | 17.86% |
| 1975 | 802.89 | 632.04 | 881.81 | 632.04 | 852.41 | 38.32% |
| 1974 | 759.13 | 855.32 | 891.66 | 577.60 | 616.24 | -27.57% |
| 1973 | 924.07 | 1,031.68 | 1,051.70 | 788.31 | 850.86 | -16.58% |
| 1972 | 950.08 | 889.30 | 1,036.27 | 889.15 | 1,020.02 | 14.58% |
| 1971 | 884.87 | 830.57 | 950.82 | 797.97 | 890.20 | 6.11% |
| 1970 | 753.12 | 809.20 | 842.00 | 631.16 | 838.92 | 4.82% |
| 1969 | 875.72 | 947.73 | 968.85 | 769.93 | 800.36 | -15.19% |
| 1968 | 903.96 | 906.84 | 985.21 | 825.13 | 943.75 | 4.27% |
| 1967 | 879.48 | 786.41 | 943.08 | 786.41 | 905.11 | 15.20% |
| 1966 | 872.78 | 968.54 | 995.15 | 744.32 | 785.69 | -18.94% |
| 1965 | 910.70 | 869.78 | 969.26 | 840.59 | 969.26 | 10.88% |
| 1964 | 834.09 | 766.08 | 891.71 | 766.08 | 874.13 | 14.57% |
| 1963 | 714.69 | 646.79 | 767.21 | 646.79 | 762.95 | 17.00% |
| 1962 | 639.14 | 724.71 | 726.01 | 535.76 | 652.10 | -10.81% |
| 1961 | 691.74 | 610.25 | 734.91 | 610.25 | 731.14 | 18.71% |
| 1960 | 618.02 | 679.06 | 685.47 | 566.05 | 615.89 | -9.34% |
| 1959 | 632.57 | 587.59 | 679.36 | 574.46 | 679.36 | 16.40% |
| 1958 | 491.26 | 439.27 | 583.65 | 436.89 | 583.65 | 33.96% |
| 1957 | 476.07 | 496.03 | 520.77 | 419.79 | 435.69 | -12.77% |
| 1956 | 493.21 | 485.78 | 521.05 | 462.35 | 499.47 | 2.27% |
| 1955 | 442.69 | 408.89 | 488.40 | 388.20 | 488.40 | 20.77% |
| 1954 | 334.34 | 282.89 | 404.39 | 279.87 | 404.39 | 43.96% |
| 1953 | 275.84 | 292.14 | 293.79 | 255.49 | 280.90 | -3.77% |
| 1952 | 270.35 | 269.86 | 292.00 | 256.35 | 291.90 | 8.42% |
| 1951 | 257.41 | 239.92 | 276.37 | 238.99 | 269.23 | 14.37% |
| 1950 | 216.28 | 198.89 | 235.47 | 196.81 | 235.41 | 17.63% |
| 1949 | 179.67 | 175.03 | 200.52 | 161.60 | 200.13 | 12.88% |
| 1948 | 179.78 | 181.04 | 193.16 | 165.39 | 177.30 | -2.13% |
| 1947 | 177.48 | 176.39 | 186.85 | 163.21 | 181.16 | 2.23% |
| 1946 | 191.52 | 191.66 | 212.50 | 163.12 | 177.20 | -8.14% |
| 1945 | 169.66 | 152.58 | 195.82 | 151.35 | 192.91 | 26.65% |
| 1944 | 143.32 | 135.92 | 152.53 | 134.22 | 152.32 | 12.09% |
| 1943 | 134.92 | 119.93 | 145.82 | 119.26 | 135.89 | 13.81% |
| 1942 | 107.15 | 112.77 | 119.71 | 92.92 | 119.40 | 7.61% |
| 1941 | 121.93 | 130.57 | 133.59 | 106.34 | 110.96 | -15.38% |
| 1940 | 134.64 | 151.43 | 152.80 | 111.84 | 131.13 | -12.72% |
| 1939 | 142.57 | 153.64 | 155.92 | 121.44 | 150.24 | -2.92% |
| 1938 | 132.36 | 120.57 | 158.41 | 98.95 | 154.76 | 28.06% |
| 1937 | 166.45 | 178.52 | 194.40 | 113.64 | 120.85 | -32.82% |
| 1936 | 162.07 | 144.13 | 184.90 | 143.11 | 179.90 | 24.82% |
| 1935 | 120.35 | 104.51 | 148.44 | 96.71 | 144.13 | 38.53% |
| 1934 | 98.16 | 100.36 | 110.74 | 85.51 | 104.04 | 4.14% |
| 1933 | 84.50 | 59.29 | 108.67 | 50.16 | 99.90 | 66.69% |
| 1932 | 64.53 | 74.62 | 88.78 | 41.22 | 59.93 | -23.07% |
| 1931 | 138.60 | 169.84 | 194.36 | 73.79 | 77.90 | -52.67% |
| 1930 | 236.04 | 244.20 | 294.07 | 157.51 | 164.58 | -33.77% |
| 1929 | 313.54 | 307.01 | 381.17 | 198.69 | 248.48 | -17.17% |
| 1928 | 226.17 | 203.35 | 300.00 | 191.33 | 300.00 | 49.48% |
| 1927 | 176.07 | 155.16 | 200.93 | 152.73 | 200.70 | 27.67% |
| 1926 | 153.00 | 151.08 | 166.14 | 135.20 | 157.20 | 4.05% |
| 1925 | 134.40 | 121.25 | 159.39 | 115.00 | 151.08 | 25.37% |
| 1924 | 99.65 | 95.65 | 120.51 | 88.33 | 120.51 | 26.16% |
| 1923 | 94.87 | 98.77 | 105.38 | 85.91 | 95.52 | -2.70% |
| 1922 | 93.24 | 78.91 | 102.76 | 78.59 | 98.17 | 21.50% |
| 1921 | 73.39 | 72.67 | 81.50 | 63.90 | 80.80 | 12.30% |
| 1920 | 90.01 | 107.23 | 108.85 | 66.75 | 71.95 | -32.90% |
| 1919 | 99.79 | 82.60 | 119.62 | 79.35 | 107.23 | 30.45% |
| 1918 | 80.97 | 76.68 | 89.07 | 73.38 | 82.20 | 10.51% |
| 1917 | 87.87 | 96.15 | 99.18 | 65.95 | 74.38 | -21.71% |
| 1916 | 95.27 | 98.81 | 110.15 | 86.42 | 95.00 | -4.19% |
| 1915 | 74.45 | 54.63 | 99.21 | 54.22 | 99.15 | 81.49% |
How many companies are in the Dow Jones Industrial Average?
For those wondering how many companies are in the dow jones industrial average (the DJIA), 30 of the largest US companies is the answer. Most investors equate a rising Dow Jones to a healthy US economy and a falling Dow to a weak economy.
The companies that make up the Dow Jones index are ranked differently such that firms with higher share prices have a greater weighting than the companies with lower share prices. Each stock in the Dow Jones index contributes a unique percentage to its overall value, making it a price-weighted index. In the past, some companies have been removed from the Dow Jones index after their market capitalisation fell by a large margin. Better and growing firms replaced them.
Some analysts and investors have criticised the Dow’s calculation based on stock price instead of a company’s market capitalisation. Therefore, companies with lower stock prices but higher valuations might have a lower weighting than corporations with higher stock prices but lower market capitalisation. As a result, many argue that the Dow should be calculated based on each company’s valuation.
Dow Jones Chart Analysis
Dow Jones chart analysis refers to the in-depth examination of the index’s price movements over time. Dow Jones technical analysis aims to identify trade opportunities that offer a good balance between the potential losses and gains.
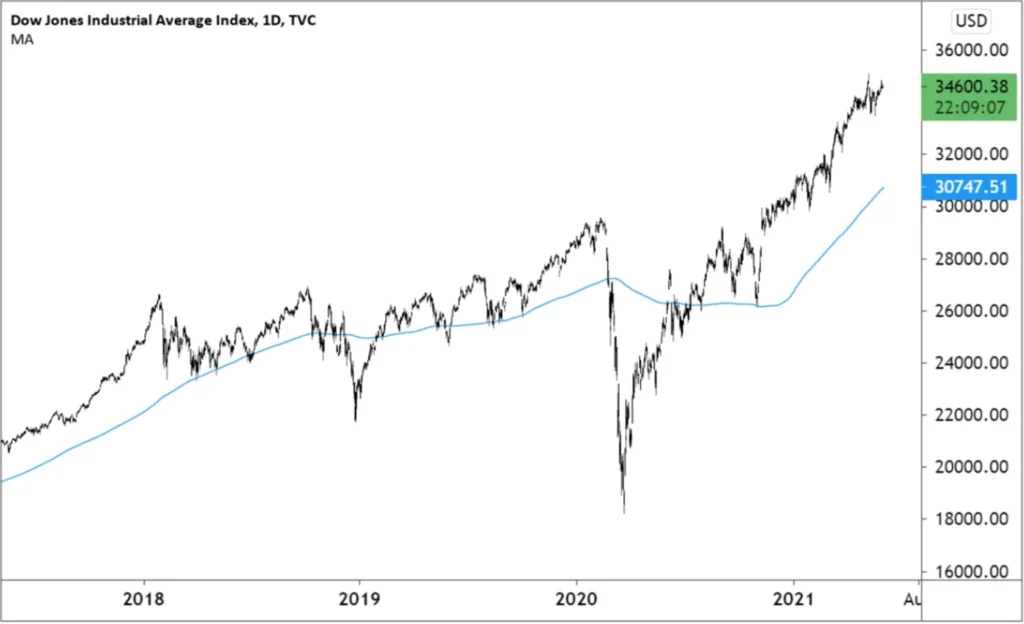
Some of the indicators used to analyse the Dow Jones chart include the 200 DMA (daily moving average), which tracks whether the index is in an uptrend or downtrend.

The moving average indicator works by adding the closing prices of the index over a set period, such as the past 200 days and dividing the total by the number of days. For example, the 20-day and 50-day daily moving averages usually identify short-term trends that play out over weeks.
Long-term traders typically use the 100-day and 200-day moving averages to make investment decisions. They make bullish trades when the Dow trades above both moving averages and take bearish positions when the index is below both MAs.
Swing traders use the 50-day and 100-day moving averages to identify bullish and bearish trade setups, whilst short-term traders use the 50-day and 20-day MAs to identify trade setups aligned with their trading style.
Dow Jones Chart with a 200-day Moving Average
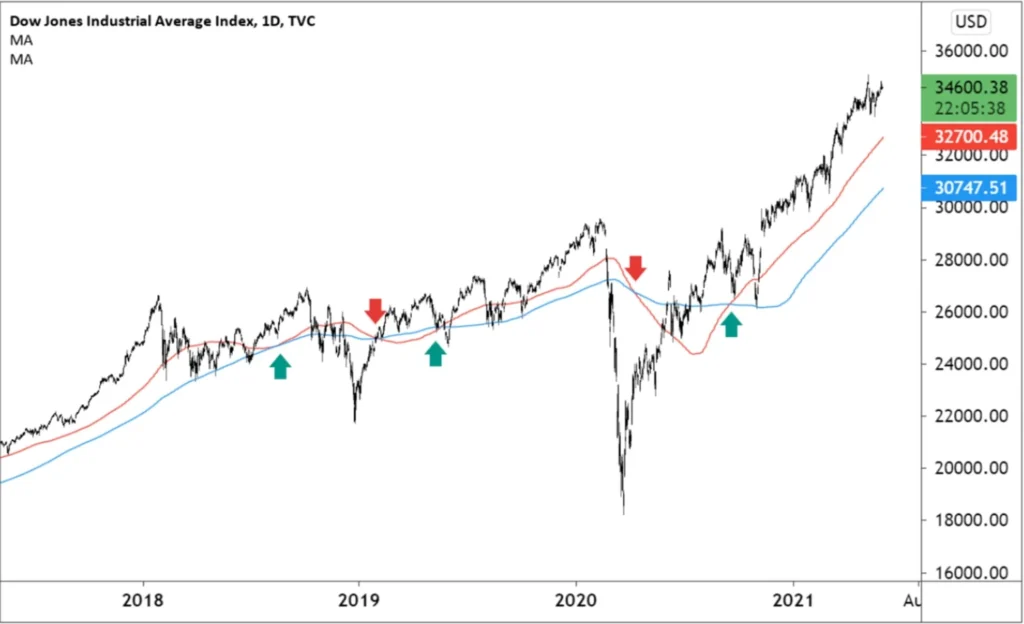
An alternative to buying or selling when the price is above or below both moving averages is to trade when one moving average crosses the other.
The strategy works when one of the moving average lines crosses above the other. For example, for a bullish trend, the short-term MA line such as the 20-day MA line should cross above the longer-term moving average such as the 50-day MA line. Such a crossover indicates that a bullish trend is about to begin.
The same principle applies to traders who use other moving averages such as the 100-day and 200-day MAs or the 50-day and 100-day MAs. The opposite applies to bearish trends signalled when the short-term moving average line crosses below the longer-term one. A bear trend is likely to begin once the 100-day MA crosses below the 200-day MA.
Dow Jones Chart with a 100-DMA and 200-DMA
The green arrows show when the 100-DMA crosses the 200-DMA from below it to generate a buy signal. Whilst, red arrows show when 100-DMA moved below 200-DMA and generated a sell signal.
Best Broker for Trading the Dow Jones Industrial Average
The best broker for trading the Dow Jones Industrial Average (DJIA) is one that allows you to profit from both falling and rising prices, and ATFX allows you to do this without significant margin requirements. Trading the Dow Jones with ATFX also means that you will save on financing costs and commissions.
Given that CFDs are products that mirror the index, you do not need a large account balance to trade the index like you would with a traditional stockbroker. For example, at writing, the Dow was trading at 34,000, and you would need an account with a minimum of $70,000 to trade the actual index. In comparison, the minimum account balance at ATFX is $200, as the broker allows you to trade fractions of the index instead of the entire index. Therefore, you can start trading the Dow Jones with less capital than you would with traditional futures brokers or stockbrokers.
Unlike traditional brokers who charge a commission on all trades, ATFX only charges a spread on Dow Jones index trades. Thus with ATFX, you do not have to pay punitive commissions that could quickly erode all your profits if you are a retail trader.
Unlike traditional brokers, you can trade Dow Jones CFDs 24 hours, five days a week, with ATFX, which gives you more trading opportunities. Traditional brokers have to stick to the regular market hours.
FAQ
It is quite unlikely that the NASDAQ will surpass the Dow, given that the Dow tracks the 30 largest companies in the United States, including some of the largest Nasdaq stocks. However, there are no guarantees that the 3,300 stocks tracked by the Nasdaq will always be less valuable than the 30 stocks in the Dow.
All three major stock indices have different criteria used to determine which companies are included in the index. For example, the S&P 500 requires companies to be worth at least $11.8 billion, highly liquid and have at least 10% of their shares publicly listed.
The Dow Jones is made up of 30 of the largest public companies in the United States. The index includes companies such as Apple Inc., Coca-Cola, American Express, and Goldman Sachs.
The DJIA market capitalization was over $9.9 trillion as of mid-May 2021, with the figure constantly fluctuating based on daily price changes. The DJIA market capitalisation is calculated by adding the valuation of each of the 30 companies that make up the index.
The trading symbol for the Dow varies depending on the broker with which you are trading, given that the term Dow Jones Industrial Average and its acronym DJIA are trademarked. Most brokers will refer to the Dow as the Wall Street 30 and other similar names.
Shorting the Dow Jones is a good idea when prices are falling so that you can profit from the downtrend. However, all trading carries risk, especially shorting strategies, because markets tend to rise over the long term instead of falling.
Yes, the Dow Theory is still applicable today and forms the basis of all modern methods of technical analysis. The Dow Theory was built on the thesis that a stock’s price incorporates all the available information on the stock, which holds to date.
The S&P Dow Jones Indices company decides which companies are listed on the Dow.
The criteria for listing on the Dow Jones is not straightforward, but the ultimate goal behind the Dow’s composition is to represent the US economy accurately.
Well, some might argue that the Dow Jones Industrial Average has reached bubble territory, but this is a matter of opinion. What we are sure of is that the Dow recently hit new all-time highs and will likely break the highs as it has done throughout its existence.
The DJI Average was trading at 19804.72 on January 19, 2017, a day before President Donald Trump took office. The Dow has since risen to a new all-time high of 35,084 on May 10, 2021.