The GBPUSD exchange rate has been unwinding over the last two weeks as traders look to inflation numbers.
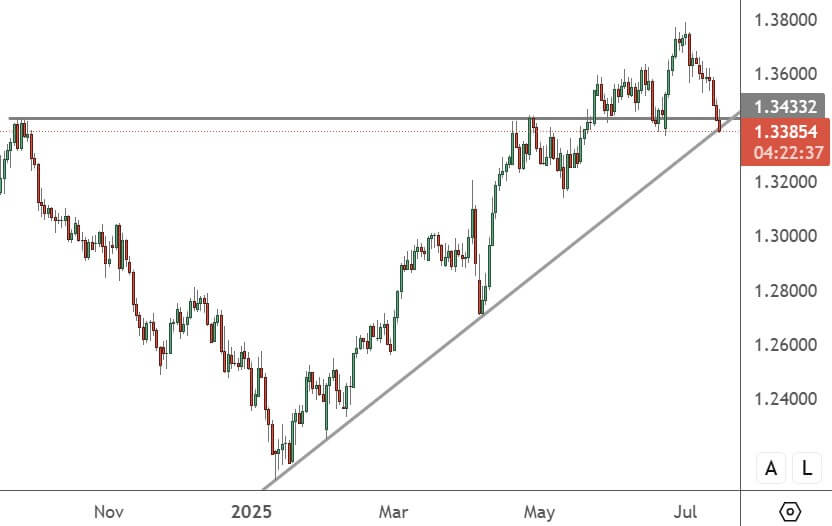
GBPUSD – Daily Chart
The GBP vs USD has shown some weakness in the last days, hinting at a trendline break and further correction. This aligns with the October highs and could target the 1.3000 level.
The British economy has economic data released on Wednesday at 2 pm HKT. Consumer price index inflation figures and retail prices will guide investors on the interest rate outlook.
Consumer prices are expected to show a 3.5% annual growth rate as inflation remains sticky. That was pushing the pound higher, but recent attention on the UK’s fiscal woes has led traders to take profits.
In data released last week, the UK economy unexpectedly contracted in May, despite a pause in tariffs from the United States. GDP showed a 0.1% contraction for the latest quarter after 0.1% growth was expected.
That followed a -0.3% drop in April, after President Trump announced his global tariffs. An interest rate cut was already scheduled in August, with investors upping their bets on a 0.25% move lower by the Bank of England.
Analysts from Pantheon Macro said the economic data was not as bad as the figures hinted.
“The size of the manufacturing drop looks erratic to us and should partly unwind. There are signs that GDP growth can rebound in June”, said Pantheon’s chief UK economist, Rob Wood.
However, the economy is struggling, and the government is considering tax hikes for the wealthy and middle class to fill budget gaps. That is adding pressure to the British pound, and it would not be a surprise to see the support levels breached after recent weakness.