



Key Highlights
Focus of the Day: Market attention is centered on the US-China presidential summit. Ahead of the meeting, US Treasury Secretary Scott Bessent said Washington and Beijing had agreed to extend their existing trade truce until January 10, 2027. A stable outcome from the summit could help ease concerns over trade tensions and tariff-related uncertainty, potentially supporting broader risk sentiment. The Swiss National Bank (SNB) will also announce its interest rate decision today. Markets widely expect the SNB to leave its policy rate unchanged at 0.00%, with attention likely to focus on its updated economic assessment and forward guidance. |
Global Market Review 24/09/2026
- The three major US indices all declined overnight.
- The Dow Jones fell 0.68%, the S&P 500 dropped 0.75%, and the Nasdaq declined 1.13%.
- The US dollar strengthened toward a two-month high, driven by rising Treasury yields and heightened expectations of another Fed rate hike in October.
- The 10-year Treasury yield has now moved back above 5% after stronger PMI data.
- Gold prices fell by about 1.2%–1.3%, reaching their lowest level in roughly a week.
- WTI crude oil rebounded about 3%, supported by renewed concerns over supply risks in the Middle East after Iranian officials said significant differences remain in US-Iran negotiations.
Important Economic Calendar
| Time (GMT+8) | Event | Importance |
|---|---|---|
| Sino-US Presidential Summit | *** | |
| 08:30 | Japan Sep Manufacturing PMI (Preliminary) | |
| 09:30 | Australia Aug Unemployment Rate | |
| 15:30 | Swiss National Bank Interest Rate Decision | *** |
| 16:00 | Germany Sep Ifo Business Climate Index | |
| 20:30 | US Initial Jobless Claims | *** |
| 20:30 | US Aug Building Permits | |
| 22:00 | US Aug New Home Sales |
Key Events on September 25 (GMT+8)
| Time (GMT+8) | Event | Importance |
|---|---|---|
| 14:00 | Germany Oct GfK Consumer Climate Index | |
| 20:30 | US Aug Durable Goods Orders | |
| 22:00 | US Sep Michigan Consumer Sentiment (Final) | *** |
Markets Analysis 24/09/2026
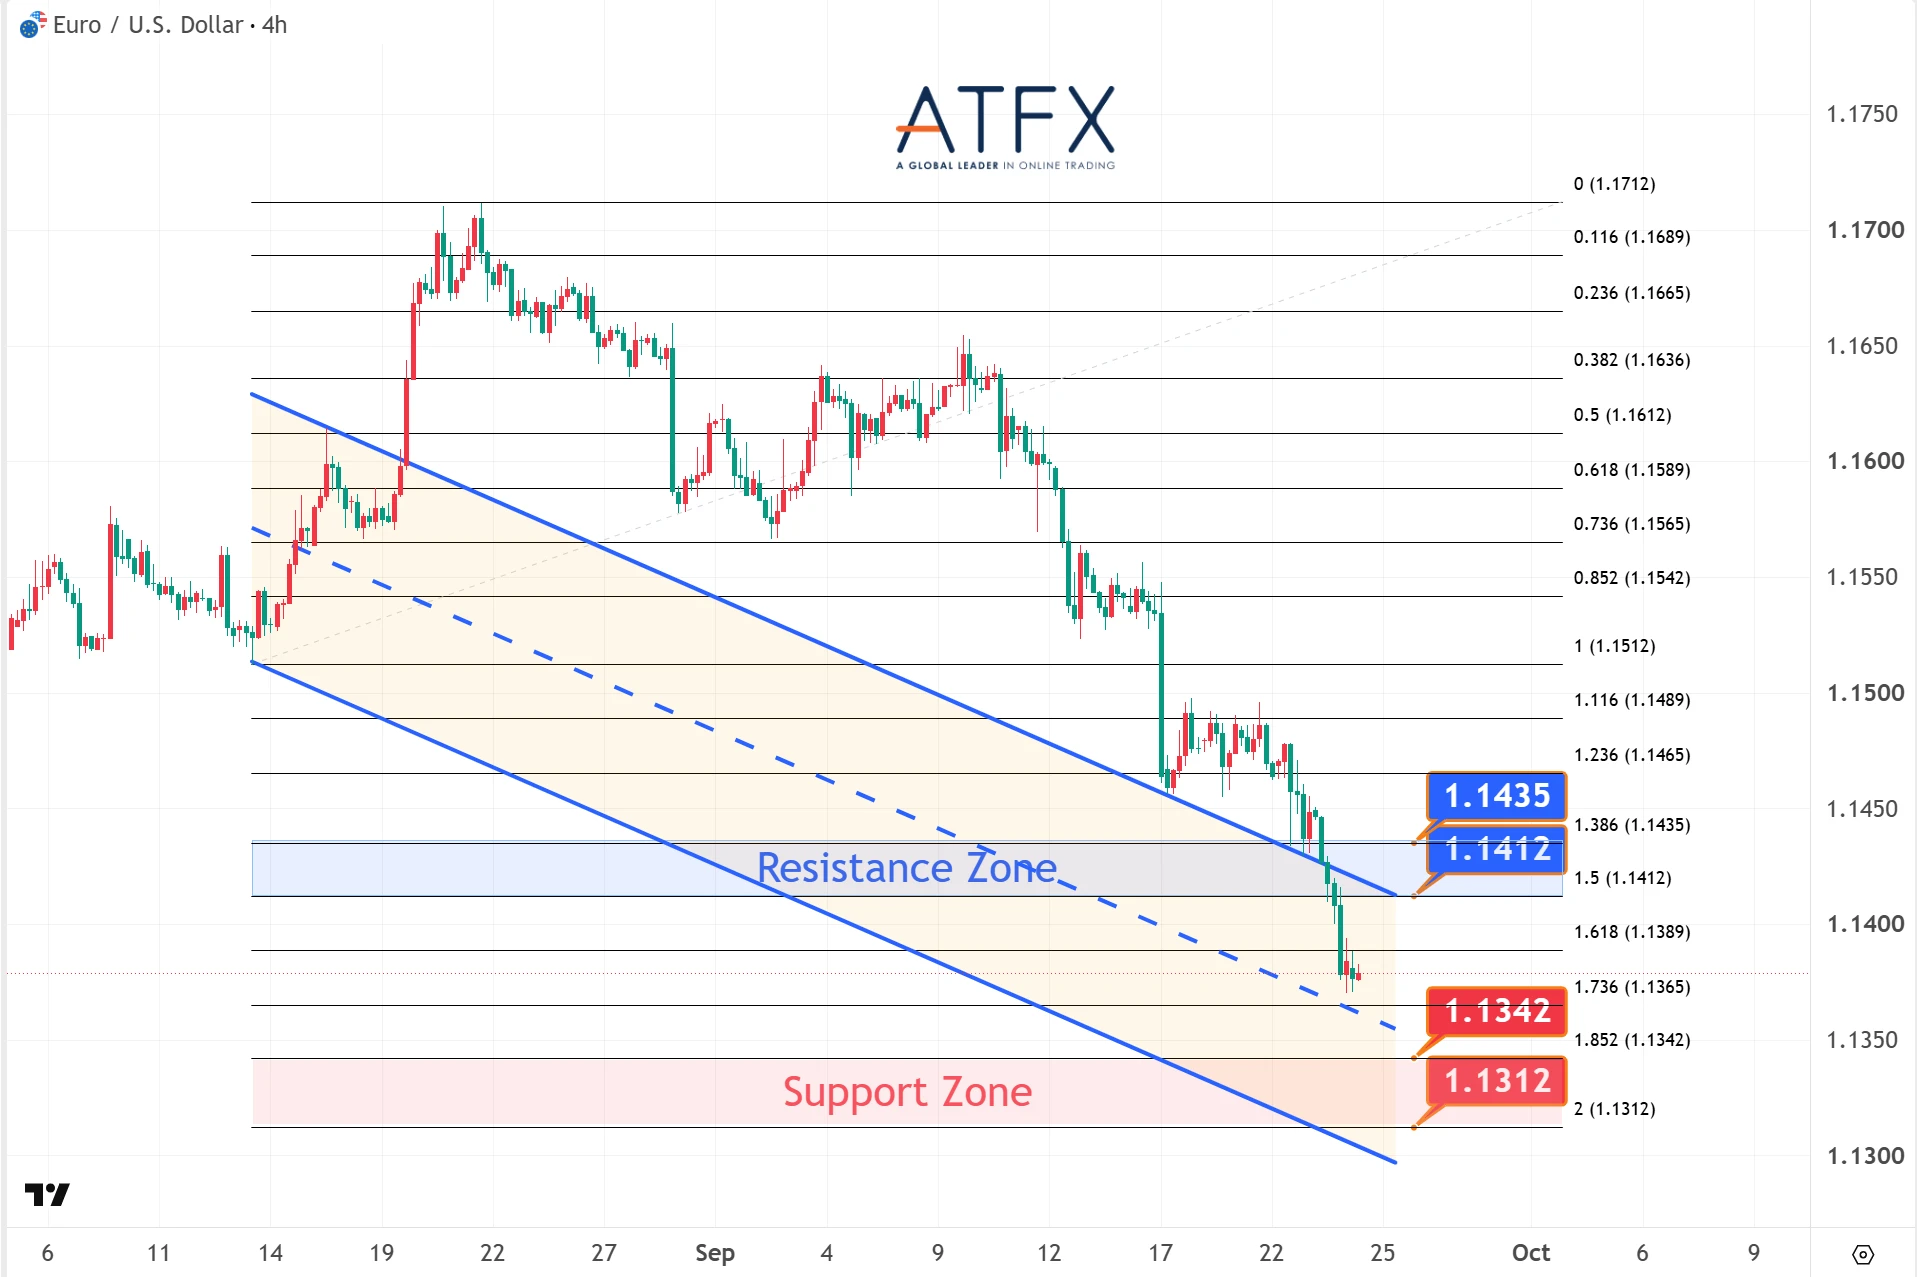
- Resistance: 1.1412 / 1.1435
- Support: 1.1342 / 1.1312
EUR/USD trended lower and broke below the 1.1400 handle, weighed down by heightened expectations of Fed rate hikes, despite overall positive Eurozone PMI data, with the composite PMI touching a three-year high.
Analyst View: The pair accelerated its decline yesterday, recording its largest daily drop in a week and touching lows last seen in late July. The 1.1400 level has now flipped to resistance. The current focus is on whether the July low around 1.1350 can provide critical support.
Direction: Under Pressure
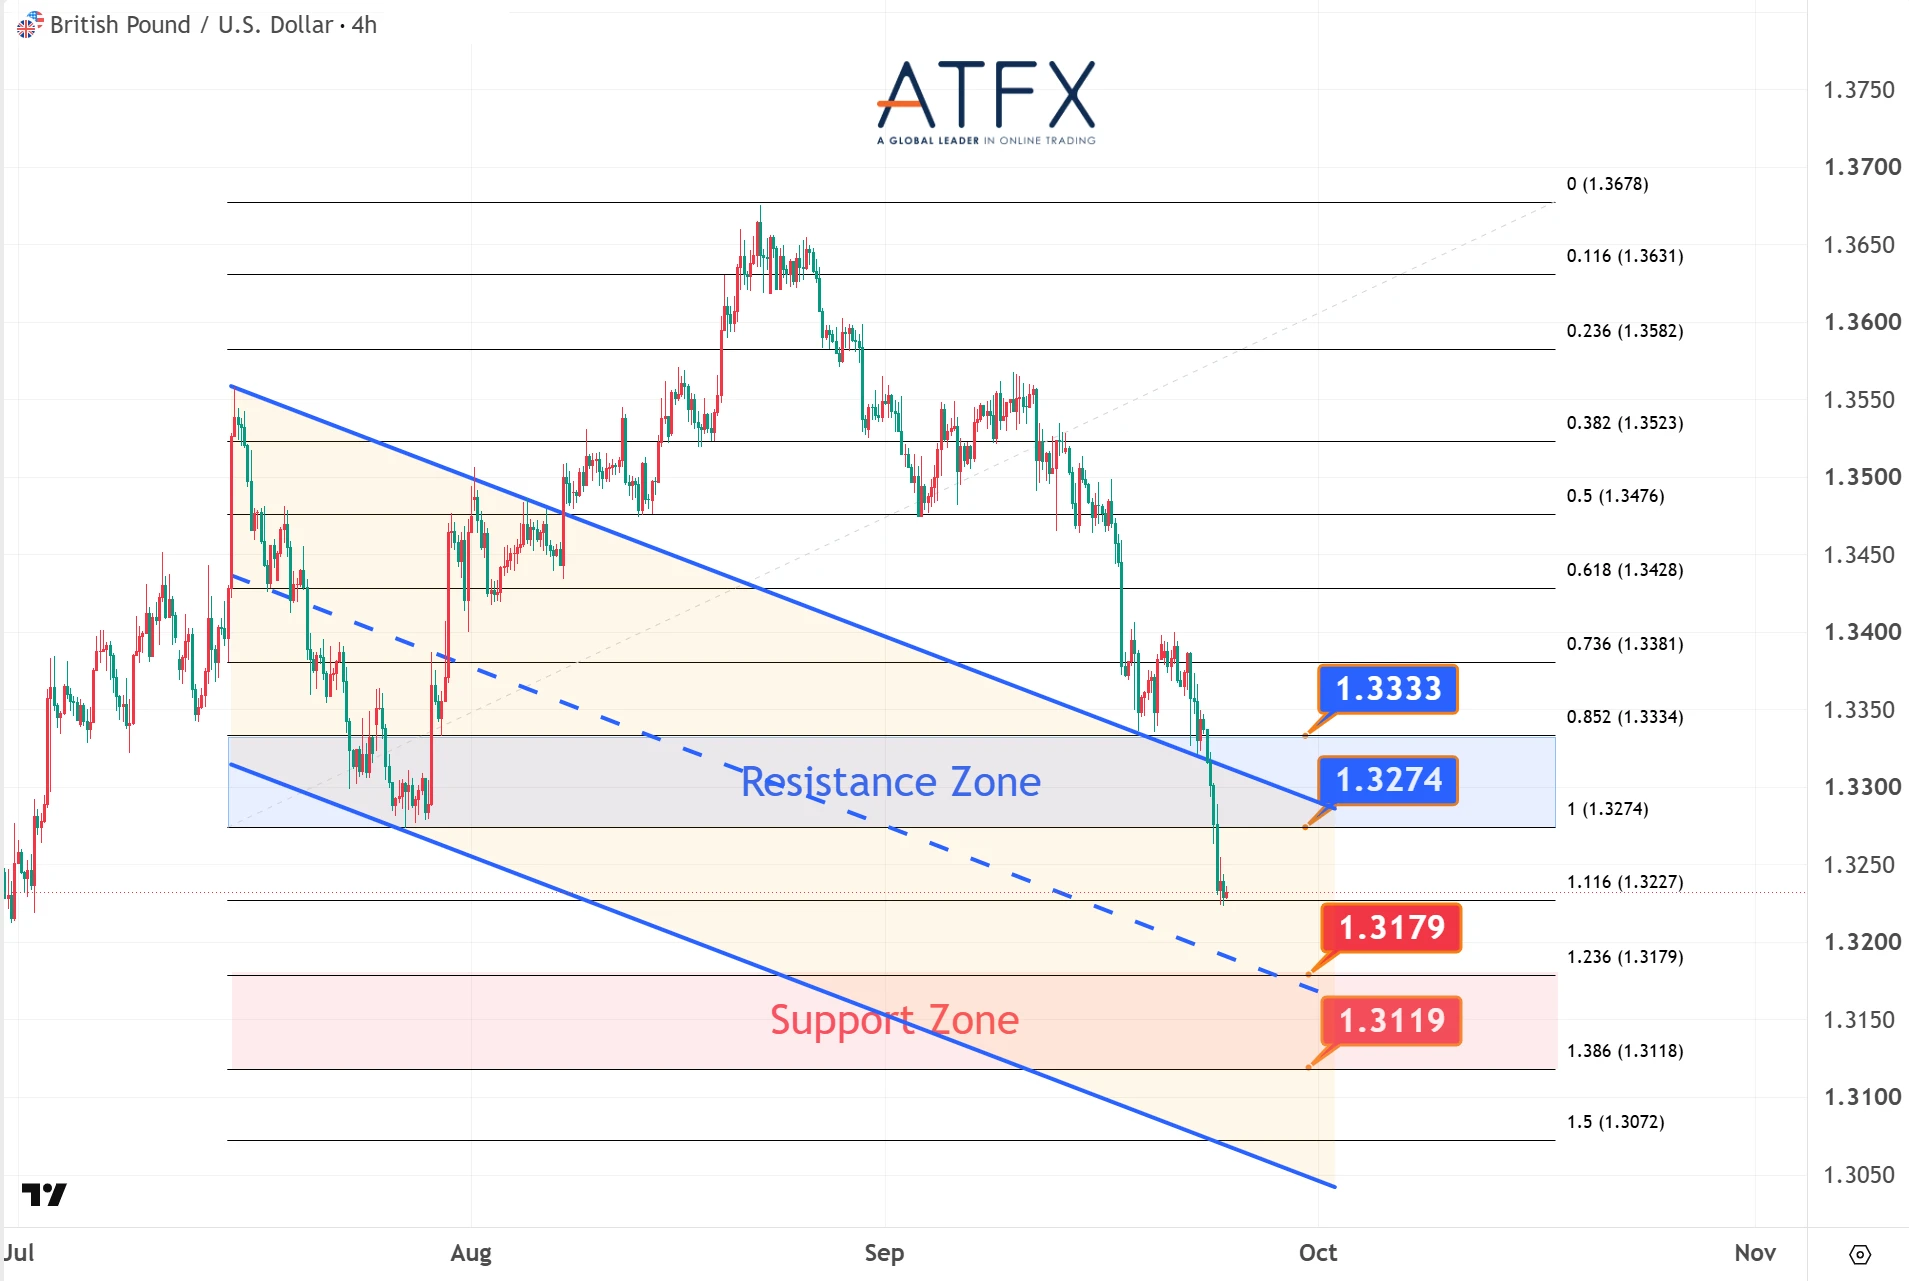
- Resistance: 1.3274 / 1.3333
- Support: 1.3179 / 1.3119
Compared with robust US data, select UK PMIs underperformed yesterday. Indirect pressure from Fed rate-hike expectations pushed the pound to its lowest level since early July.
Analyst View: The pair recorded its steepest drop in three months yesterday. It remains under pressure at these lows and risks testing levels below the 1.3200 handle.
Direction: Under Pressure
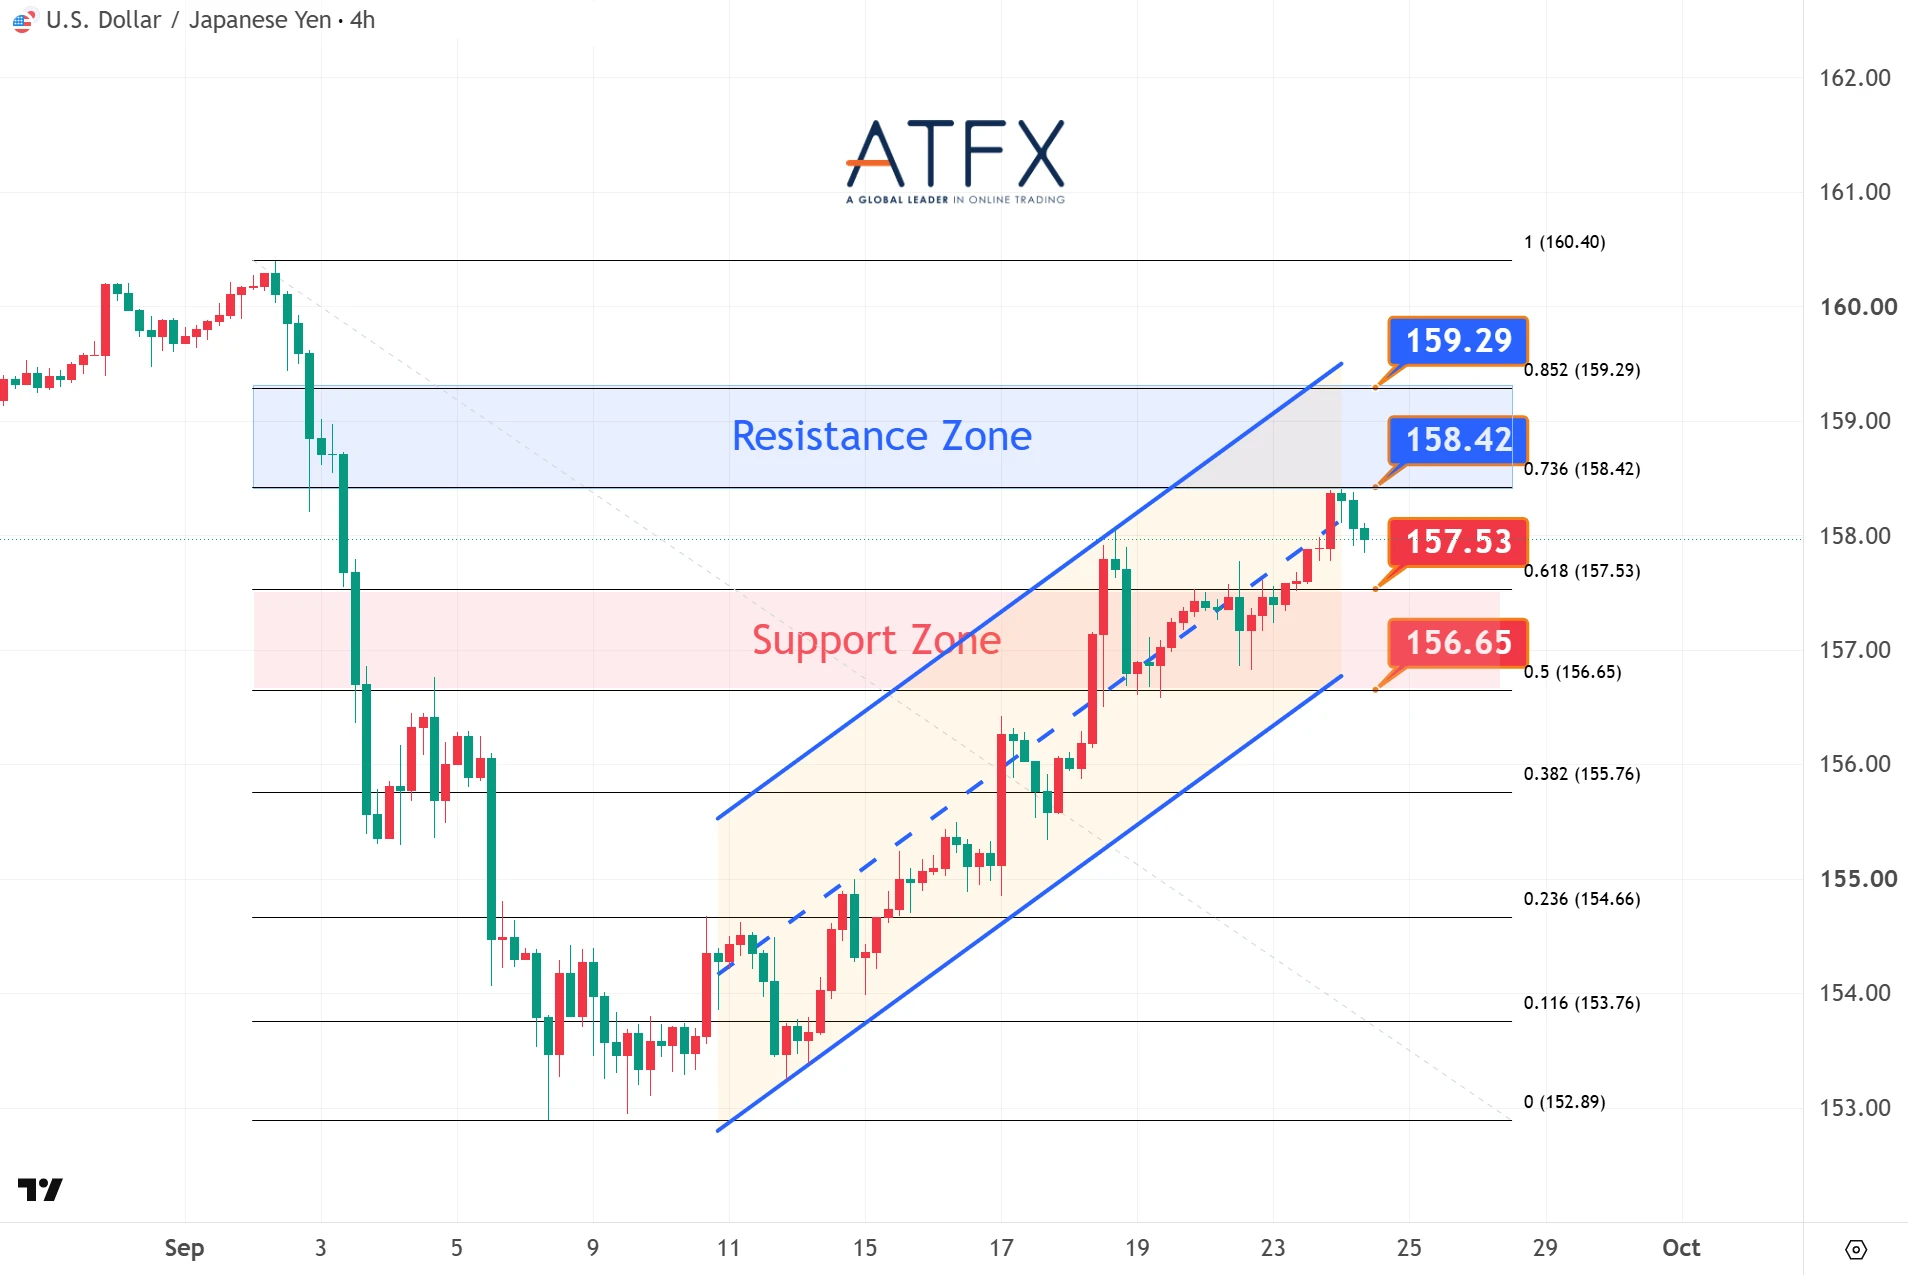
- Resistance: 158.42 / 159.29
- Support: 157.53 / 156.65
Bolstered by escalating Fed rate-hike bets, USD/JPY logged a four-day winning streak yesterday, hitting a month-to-date high and decisively breaching the 158 level.
Analyst View: The pair’s break above last week’s highs suggests that bulls have regained momentum after a brief consolidation. However, minor retracements this morning indicate a potential short-term battle between bulls and bears around 158. The broader trend remains within an ascending channel, supporting a mildly bullish outlook.
Direction: Mildly Bullish
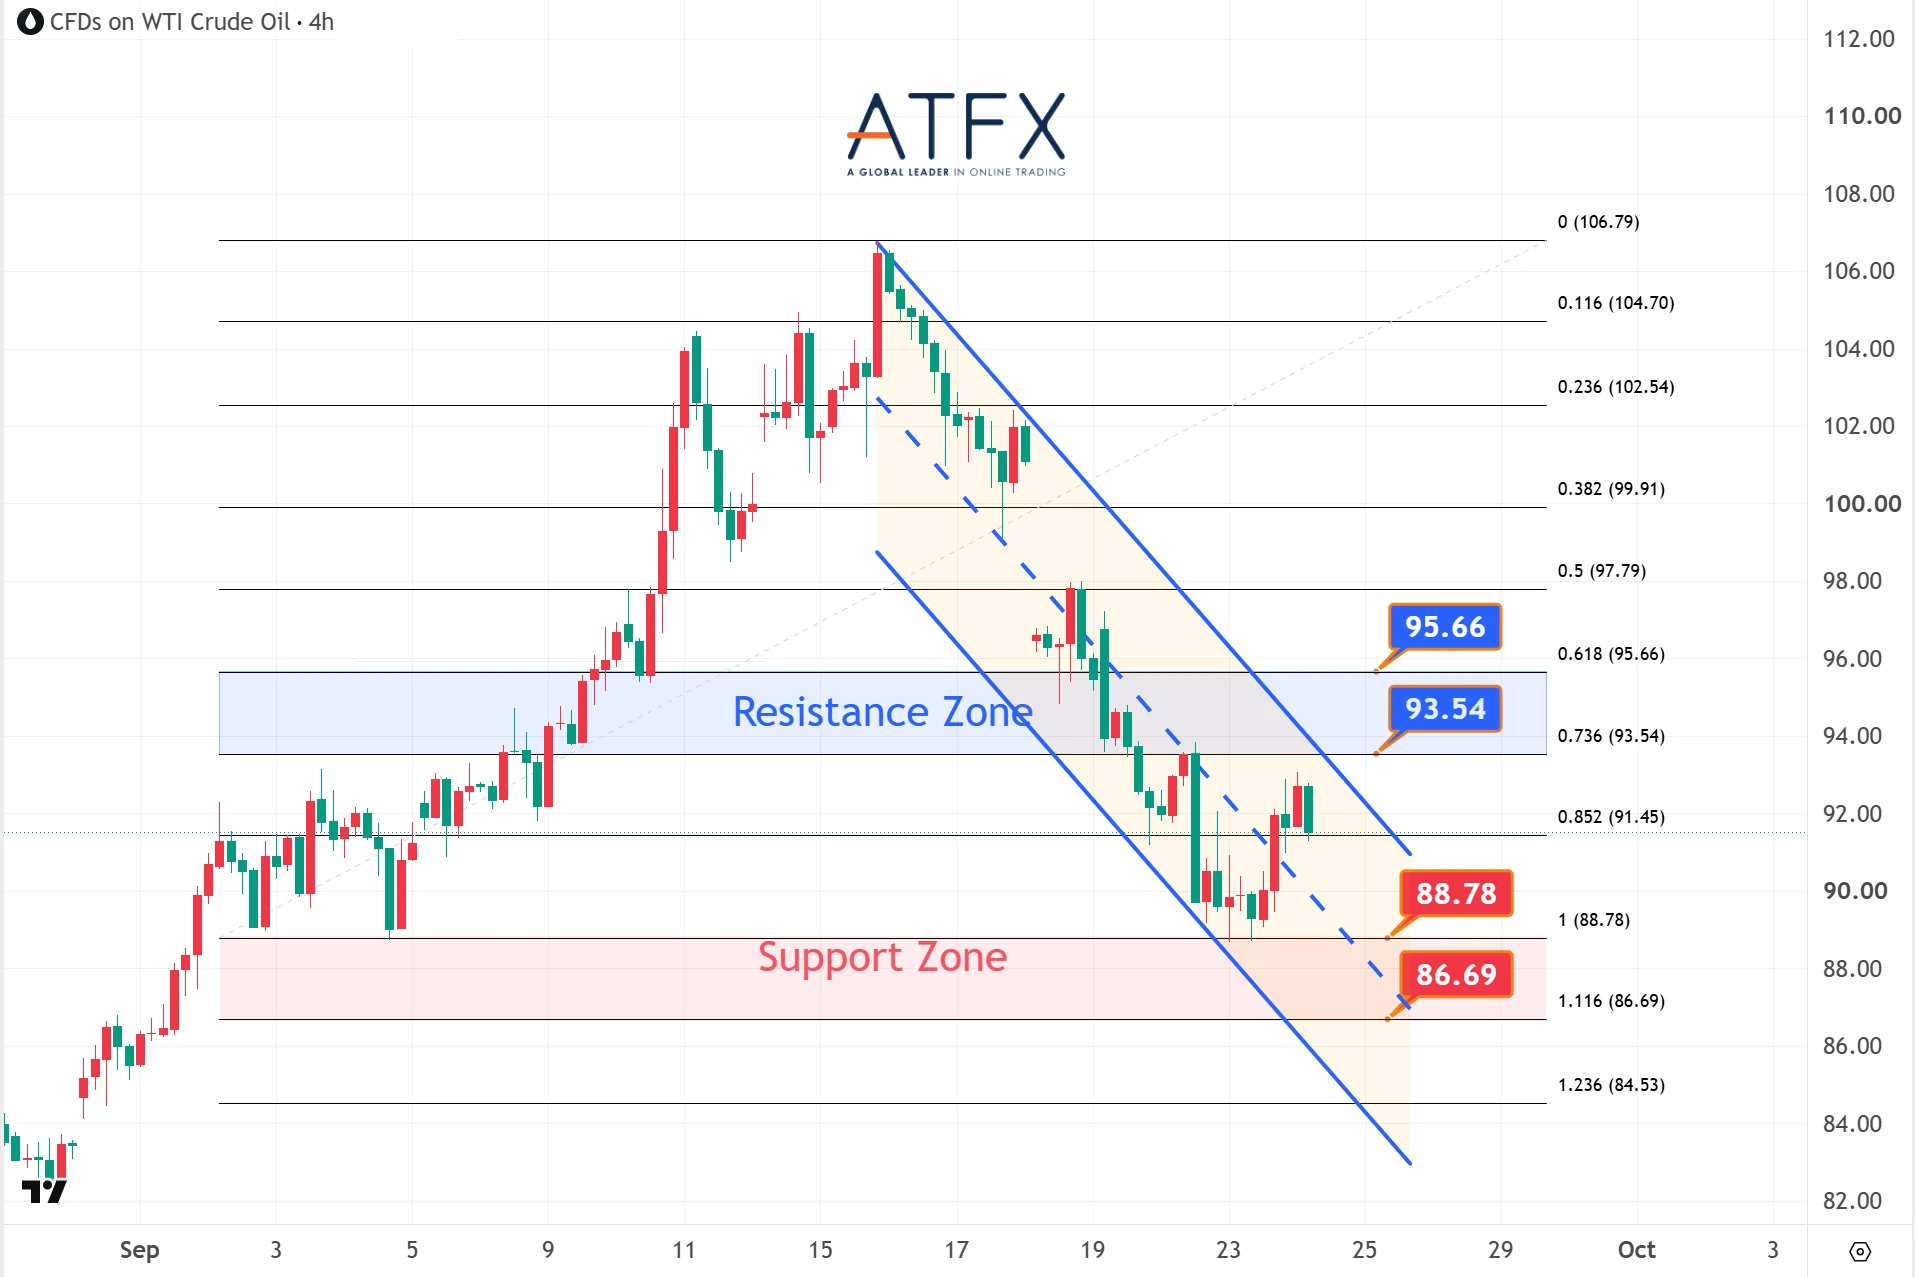
- Resistance: 93.54 / 95.66
- Support: 88.78 / 86.69
Global oil prices snapped a five-day losing streak yesterday. Iran said the Strait of Hormuz will remain closed if sanctions against the country persist.
Analyst View: Crude prices rebounded yesterday, the first since early September, and are now facing resistance to the 20-day moving average (DMA). A successful breakout could push prices back above $93; otherwise, expect consolidation at the lower end of the range.
Direction: Rebound or Rangebound
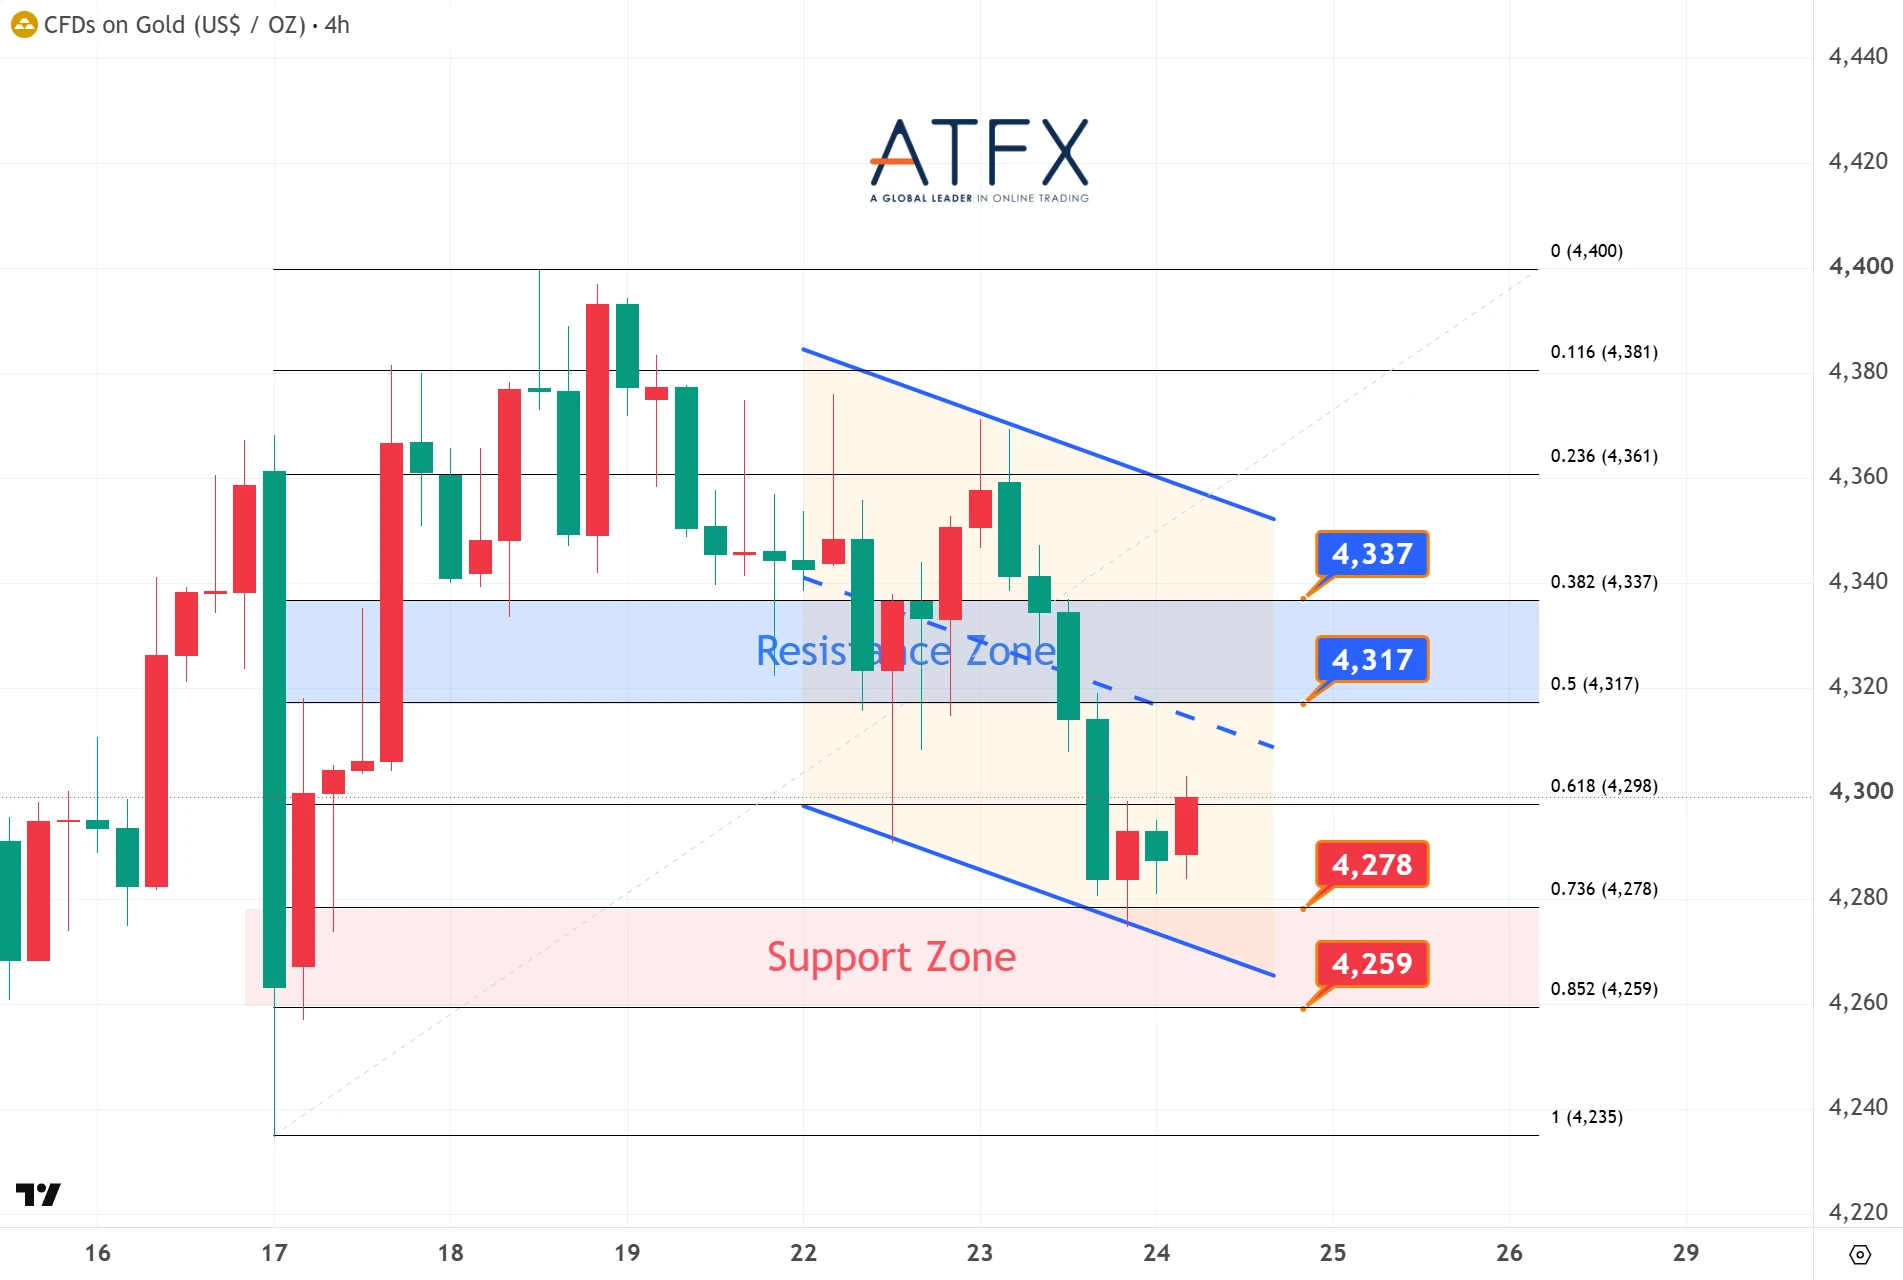
- Gold Resistance: 4317 / 4337
- Gold Support: 4278 / 4259
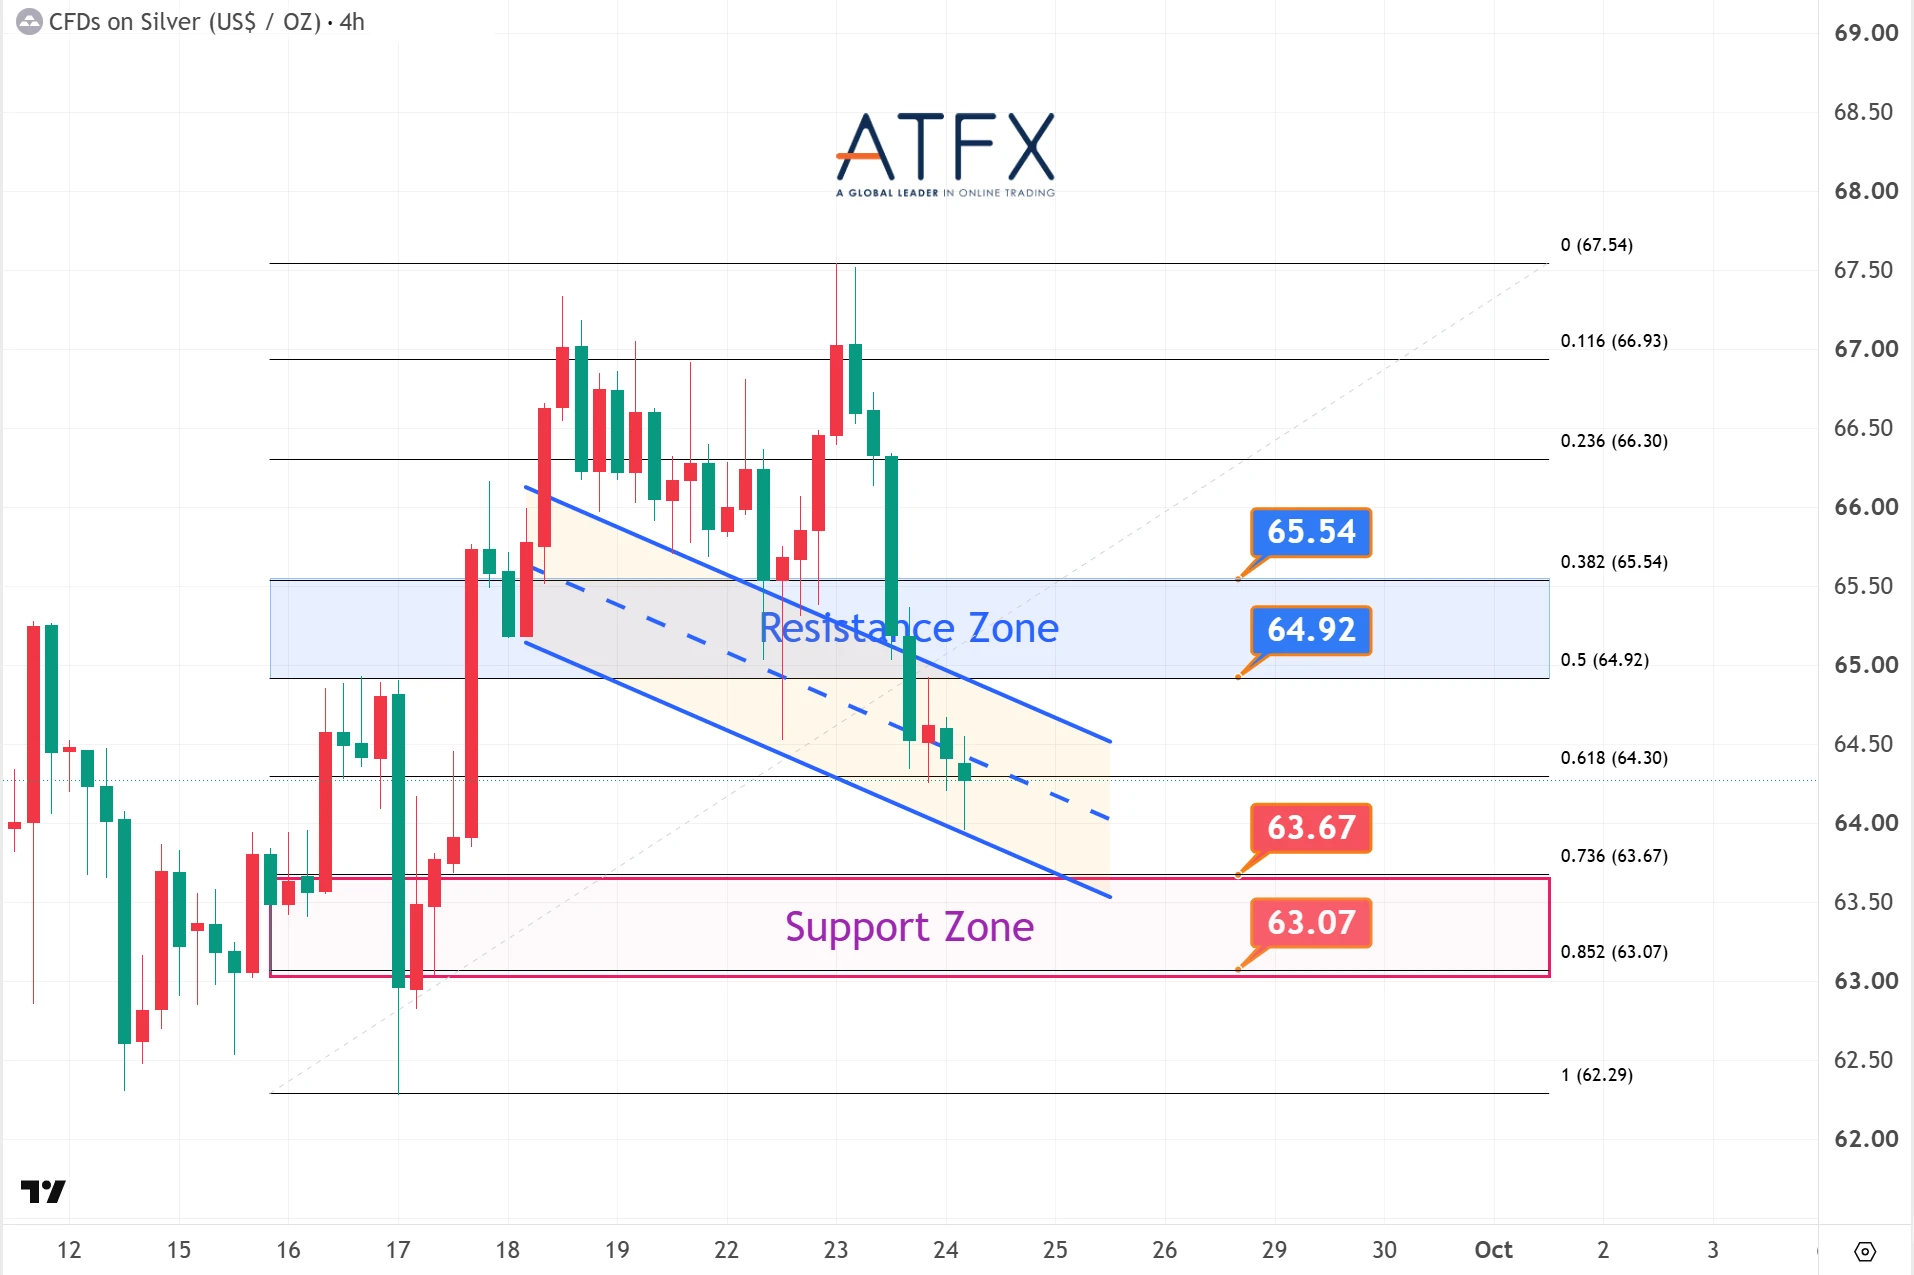
- Silver Resistance: 64.92 / 65.54
- Silver Support: 63.67 / 63.07
Positive US economic data, coupled with hawkish rhetoric from Fed policymakers, raised expectations for rate hikes. Surging yields, a stronger dollar, and rising oil prices pushed gold down more than 1% overnight.
Analyst View: Gold traded lower amid increased overnight volatility, consistently making lower highs and signaling downside pressure. Yesterday’s failed test of the 20-DMA accelerated the decline, breaching the 10-DMA. Focus pivots back to last week’s lows, with immediate support at 4278/4259, while awaiting directional cues from the Sino-US summit.
Direction: Under Pressure
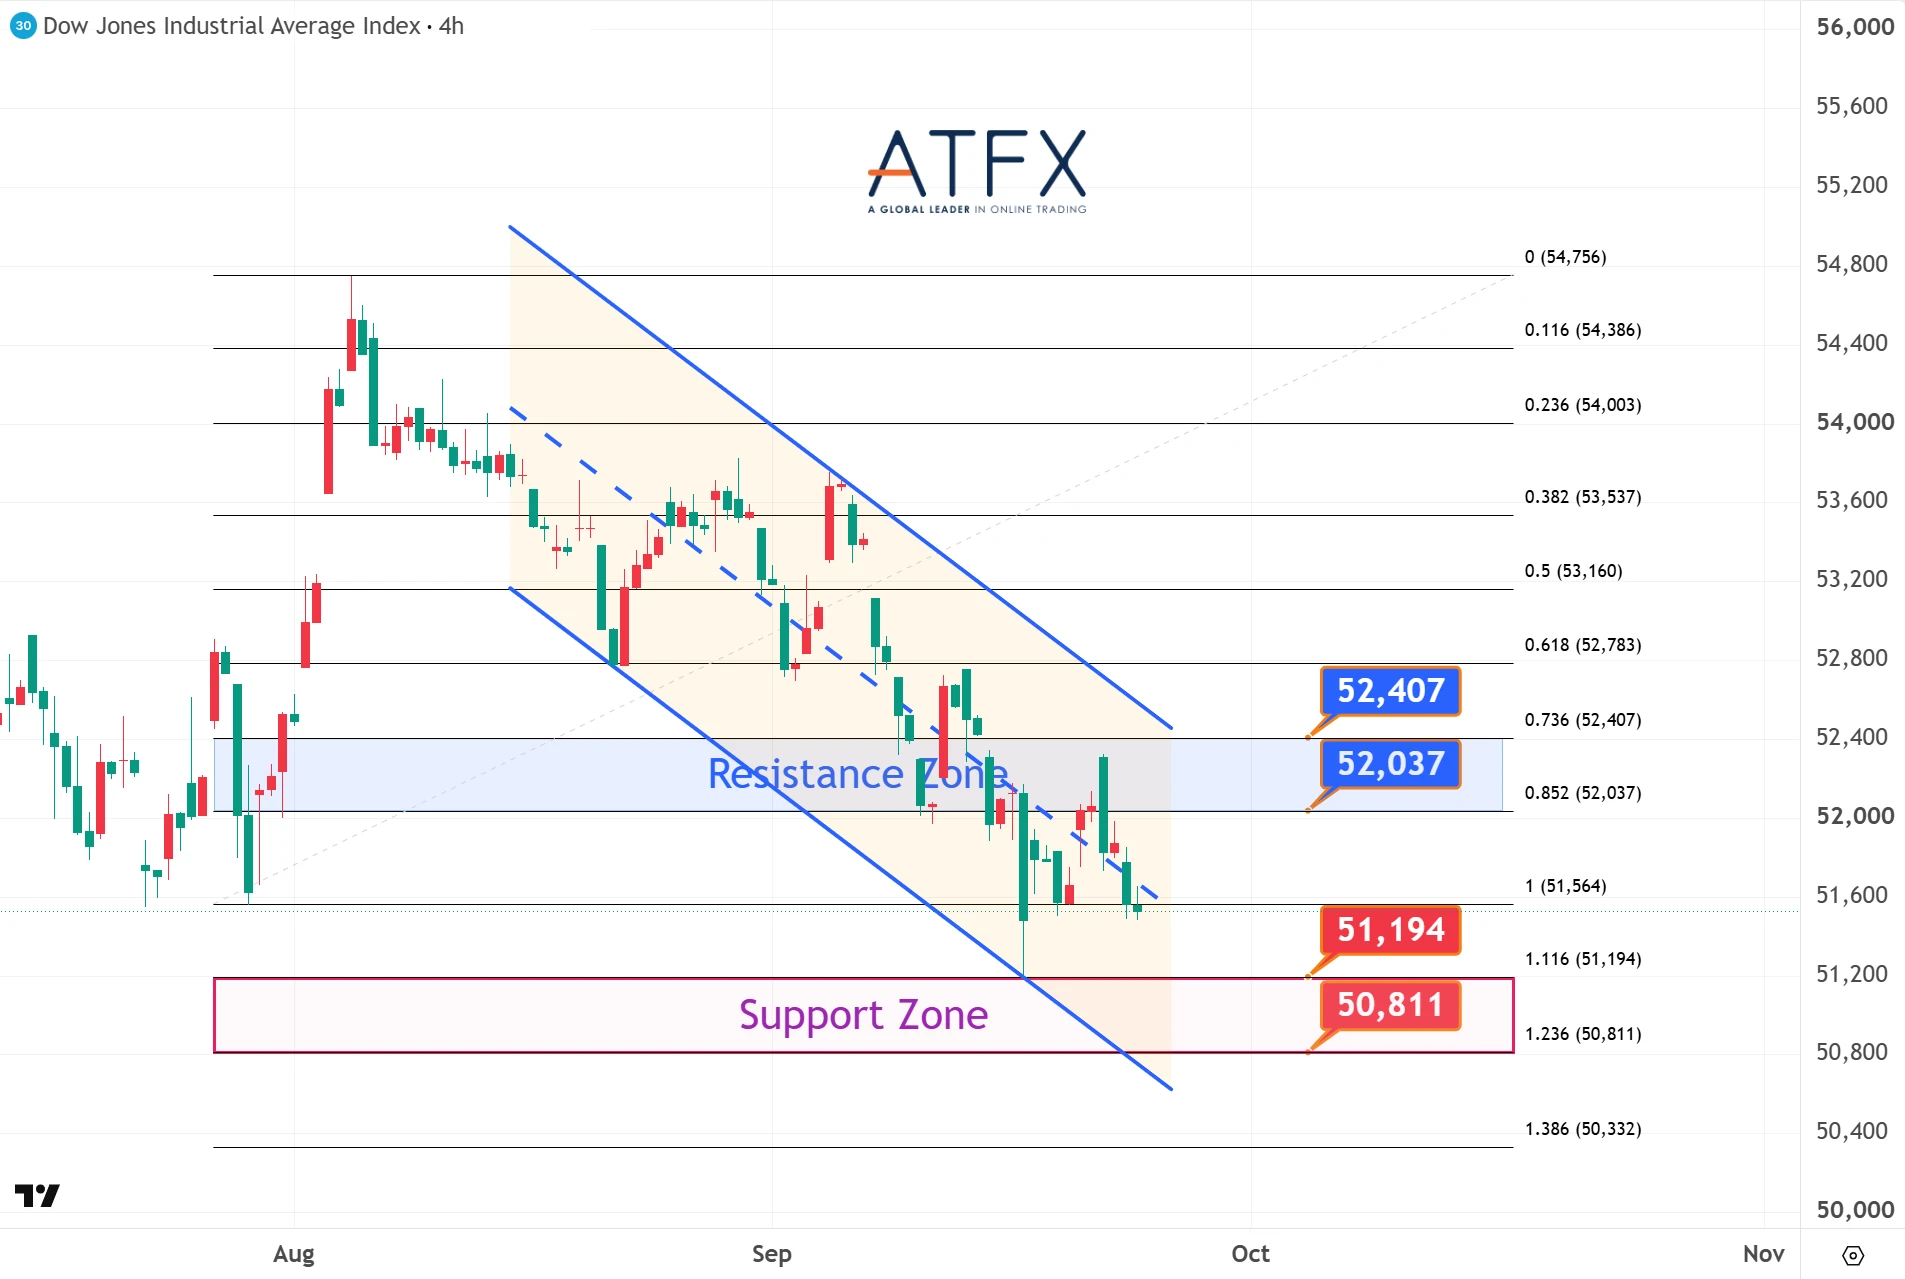
- Resistance: 52037 / 52407
- Support: 51194 / 50811
The latest US PMIs reignited October rate hike probabilities to nearly 70%. Compounded by rising yields and oil prices, all three major US indices fell on Wednesday, with the Dow recording a two-day decline.
Analyst View: The Dow continued testing the 10-DMA resistance yesterday but failed to break through, intensifying short-term corrective pressure. Attention remains on support below 51200, at last week’s lows.
Direction: Under Pressure
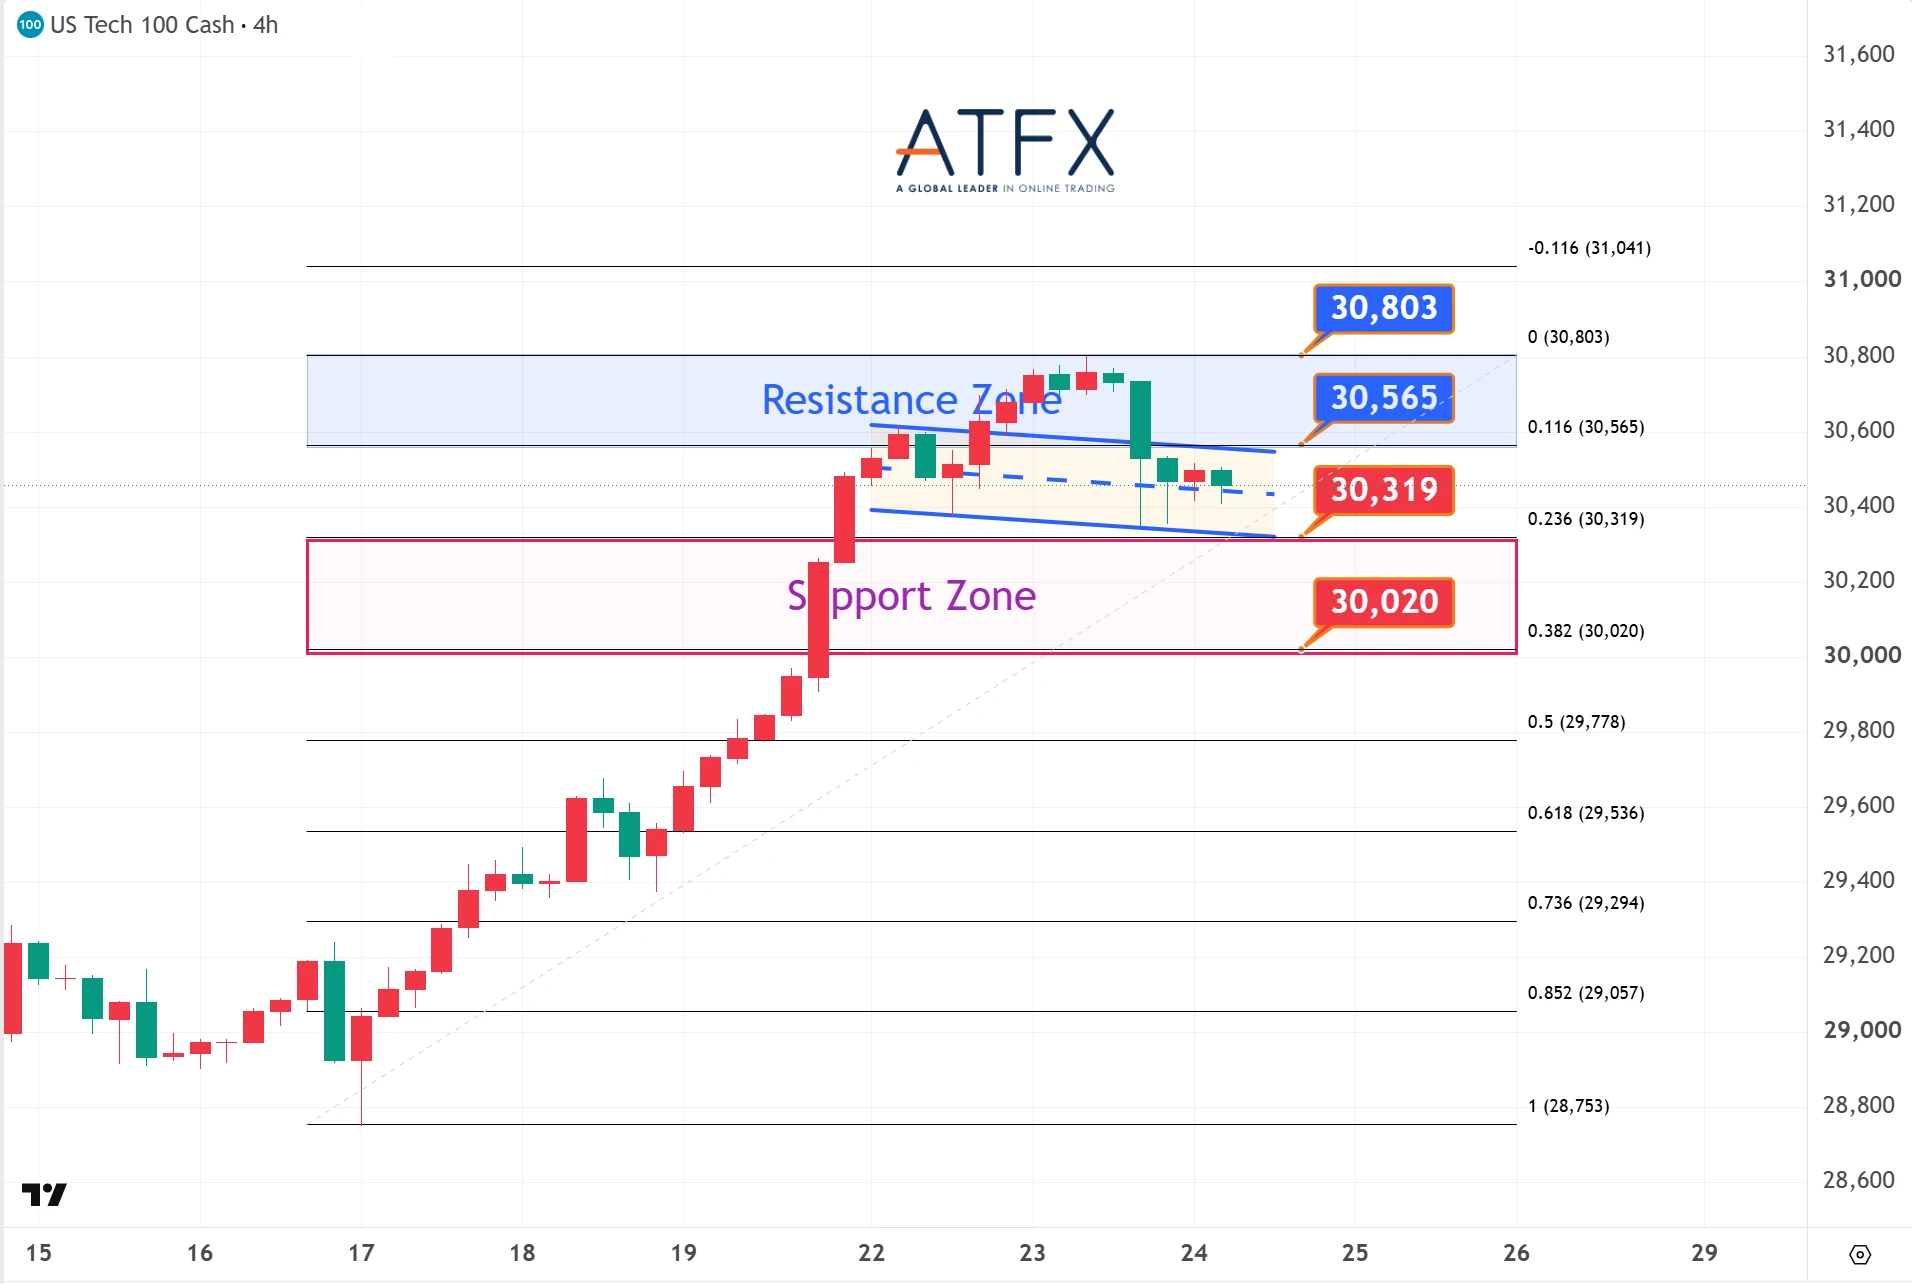
- Resistance: 30565 / 30803
- Support: 30319 / 30020
The dual headwinds of rising oil prices and robust economic data fueled market bets on a higher-for-longer Fed tightening stance. The Nasdaq snapped its winning streak overnight, giving up record highs.
Analyst View: While Nasdaq has retreated, it has not significantly deviated from its historical highs. If today’s Sino-US summit fosters a positive atmosphere, the index may resume its upward trajectory toward peak levels.
Direction: Short-Term Correction
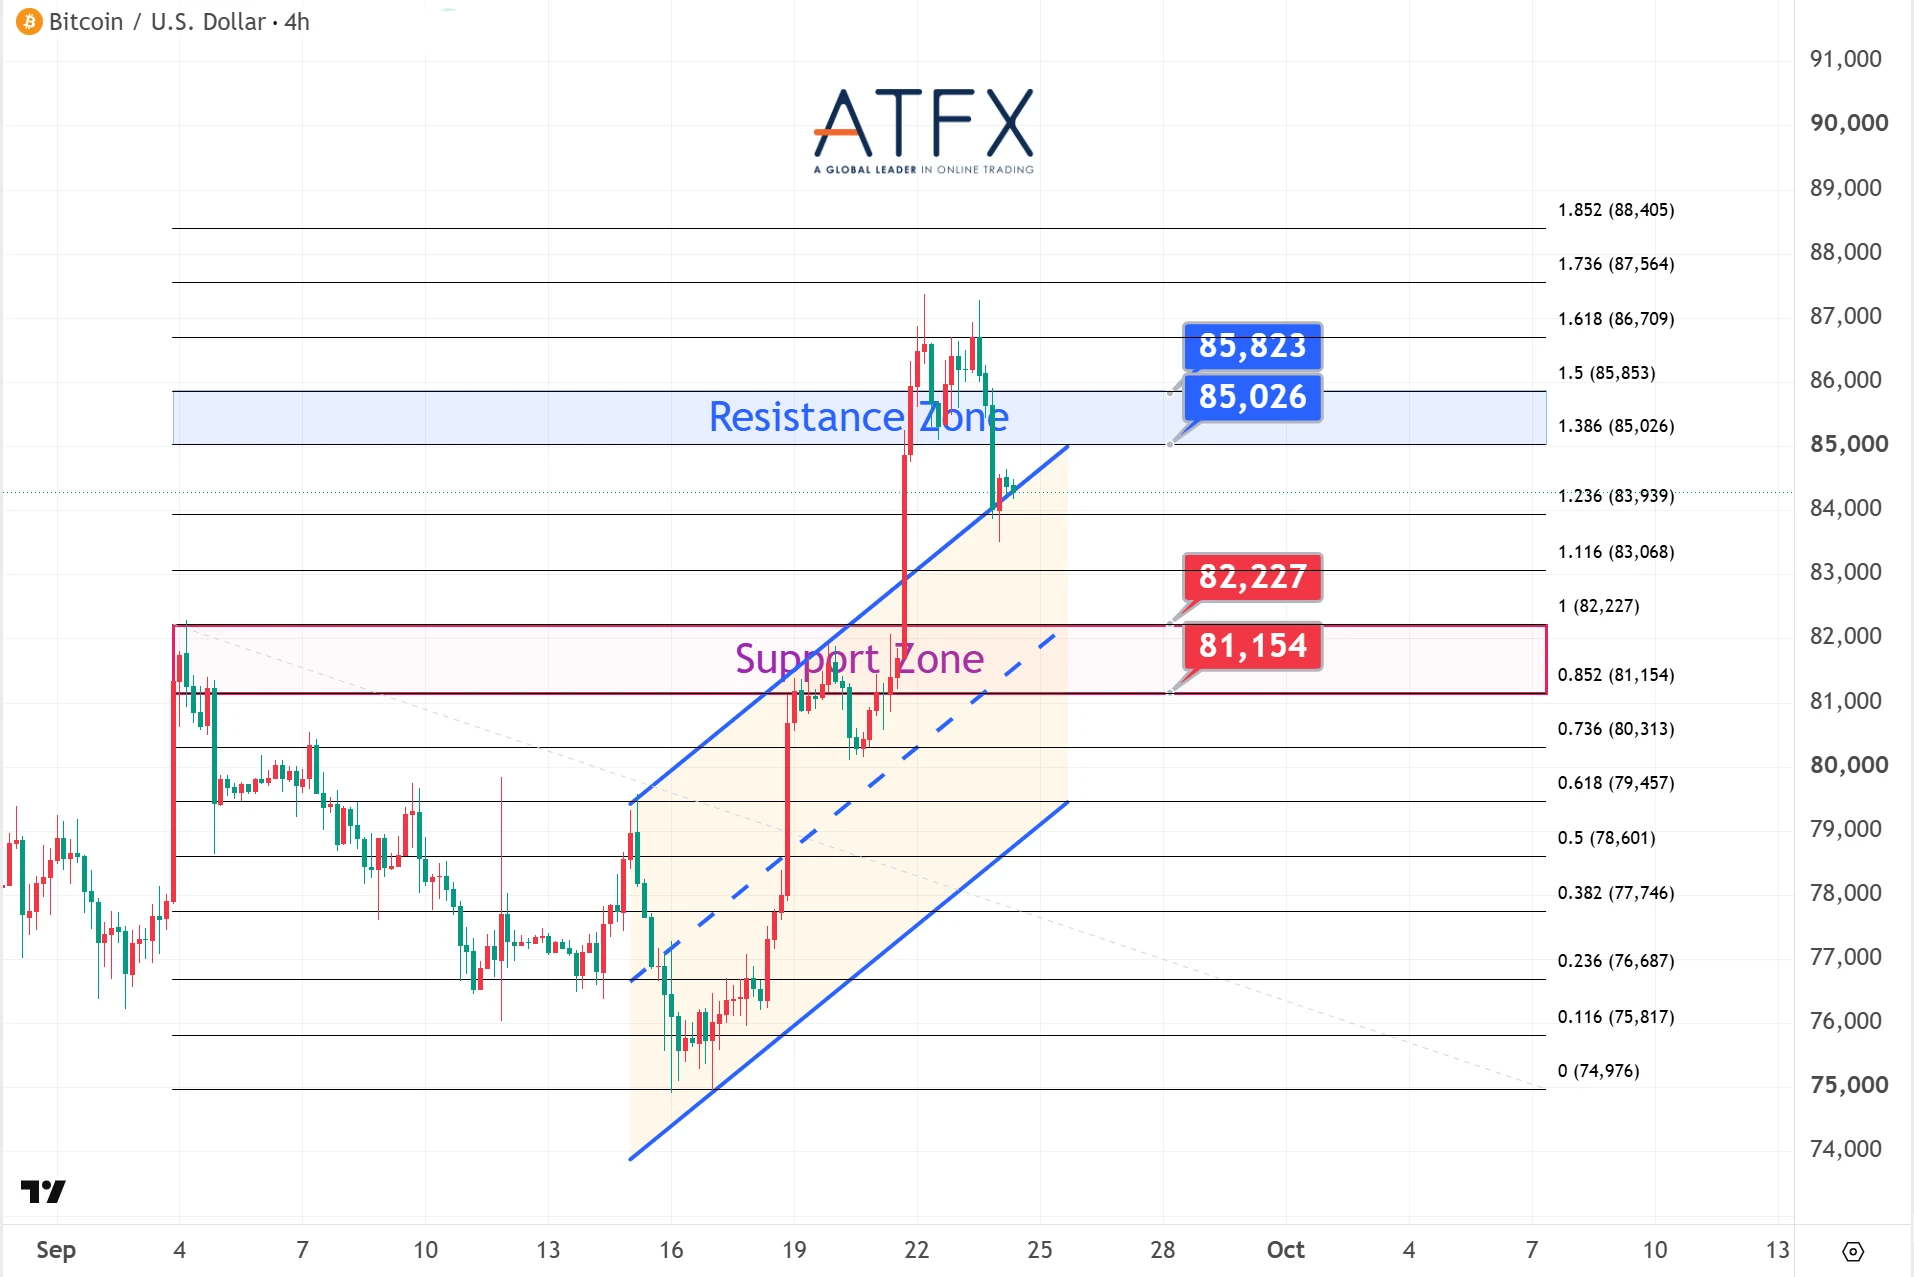
- Resistance: 85026 / 85823
- Support: 82227 / 81154
Despite reports of surging inflows into spot Bitcoin ETFs, the cryptocurrency has slipped below the $87,000 level. Market participants appear to be adopting a cautious, risk-off stance as attention shifts to the highly anticipated Trump-Xi summit.
Analyst View: Bitcoin has entered a retracement phase after failing to sustain momentum at higher levels, succumbing to short-term selling pressure. With broader markets closely watching geopolitical cues from the impending summit, price action may remain volatile and sensitive to macro headlines. The immediate focus now shifts to whether bulls can defend the critical support zone at 82227 to stem the current pullback.
Direction: Short-Term Correction
Disclaimer: This analysis is for reference purposes only. Happy trading!