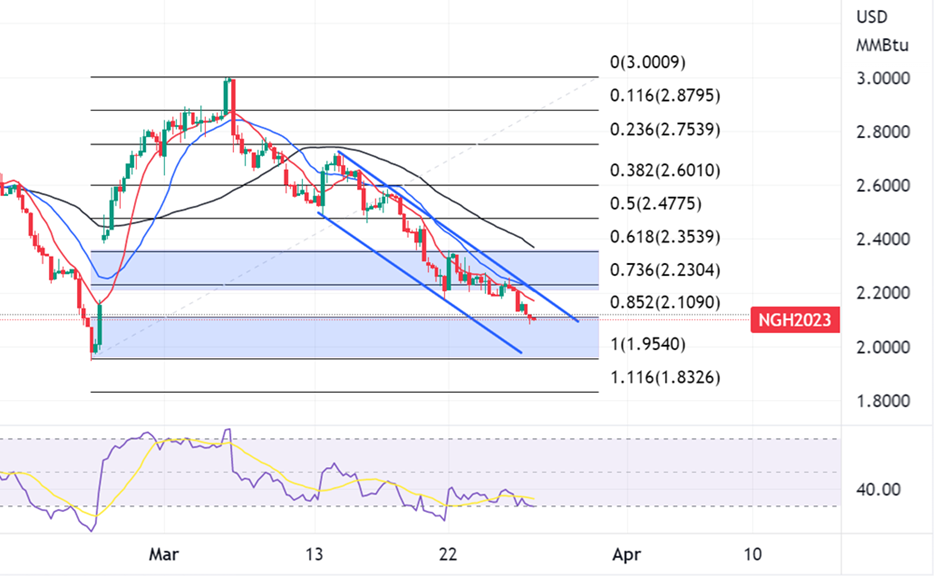
US natural gas futures (NGH) fell for a third consecutive week, settling at $2.087 per MMBtu on March 17, 2023. This is the lowest price since December 2020 and last month. The decline was attributed to a warm winter and balmy spring weather, which reduced demand for heating and cooling. As a result, the US natural gas storage level is now 36.1% higher than the year-ago level and 22.7% higher than the five-year average. The market is now looking for signs that demand will pick up as the weather turns warmer.
Natural Gas Futures Outlook
The price of natural gas dropped significantly, from a 14-year high of $10 per MMBtu in August to $7 in December, before settling in the mid-$2 range in recent weeks.
Natural gas storage in the United States stood at 1.9 trillion cubic feet (Tcf) as of March 17, 2023, a 36.1% increase from the same day a year earlier and 22.7% higher than the five-year average for that date. According to the Energy Information Administration (EIA), the increase in storage was primarily due to milder-than-normal weather conditions in the winter months.
US natural gas futures are trading near their lowest levels in recent months, but this could be a sign that the market is bottoming out. A decrease in downside momentum can sometimes precede a reversal, as investors become more confident in the market’s ability to recover.

4-Hour Chart – NGH (Falling Wedge Continues Growing)
The 4-hour chart shows that the Falling Wedge pattern, which was identified earlier this month, is still developing. As long as natural gas remains within the confines of this pattern, the near-term outlook remains bearish. However, an upside breakout would open the door to a bullish reversal. Once the price breaks through the 10 and 20 moving averages on the 4-hour chart, it would focus on the 50-period Simple Moving Average (SMA), which is currently at $2.3539 and may act as resistance.


