The vast majority of retail client accounts lose money when trading CFDs.
Important Notice - Fraud awareness
Important Notice - Scam alert
Spread bets and CFDs are complex instruments and come with a high risk of losing money rapidly due to leverage. The vast majority of retail client accounts lose money when trading CFDs. You should consider whether you can afford to take the high risk of losing your money.
Important Notice - Fraud awareness
Important Notice - Scam alert
The vast majority of retail investor accounts lose money when trading CFDs / Spread betting with this provider.
Spread bets and CFDs are complex instruments and come with a high risk of losing money rapidly due to leverage. The vast majority of retail investor accounts lose money when trading CFDs / Spread betting with this provider. You should consider whether you understand how CFDs / Spread betting work and whether you can afford to take the high risk of losing your money.
ATFX
Language
    ATFX-search-icon
    Client Portal
    Start trading
    rch

    Dow Jones Slides as a Result of Profit Taking and Soft US Retail Sales Data

    The Dow Jones had given up 110 points one hour and 20 minutes after the release of the latest US Retail Sales report. The report for October showed that US retail sales increased by 0.3% from September, and this was lower than the expected outcome of 0.5% projected by economists. The prior month’s reading was also revised lower. However, as seen from last year, retail sales in October was 5.7% higher. Annual US inflation was 1.2% in October, suggesting that inflation-adjusted annual Retail sales rose by 4.5%.

    The biggest losers are clothing stores that saw a drop of 30% of their sales from October 2019. Gasoline stations are seeing losses of 16.1% of their sales, and Restaurants and drinking places have lost 19.3%. Instead, people have been buying building materials, food and drinks to eat at home.

    Learn more about indices trading with us


    What does the soft Retail Sales report mean for the Dow Jones?

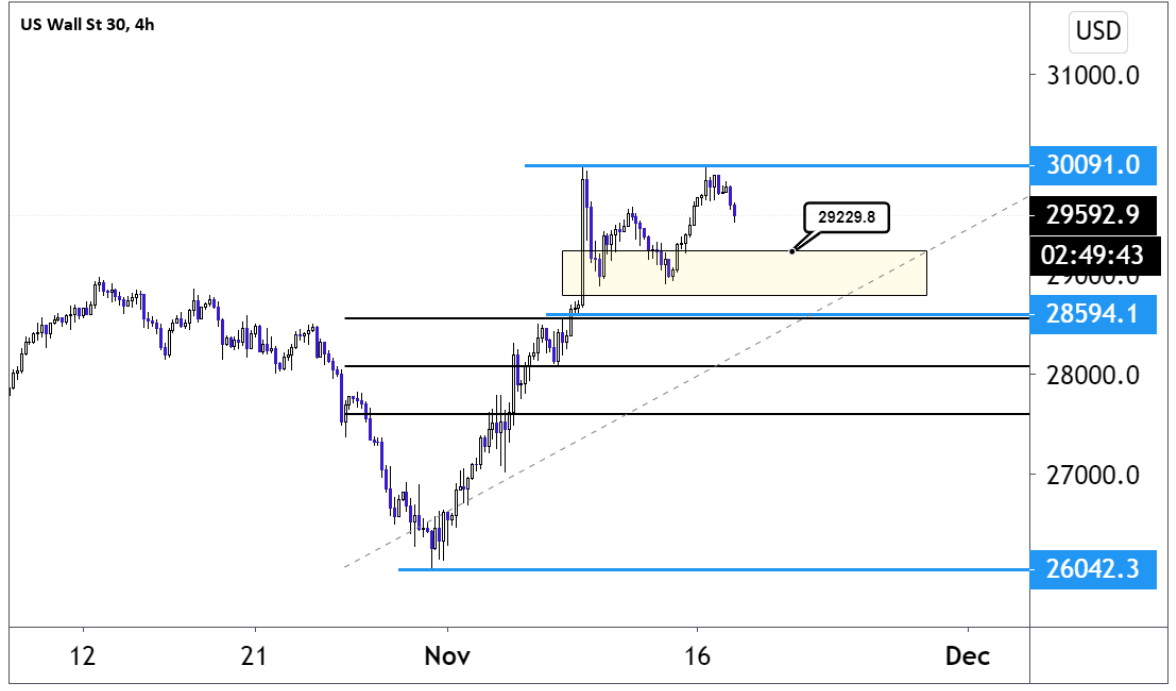
    The lower than expected growth in Retail sales figures has fast-forwarded the unavoidable price correction that was pending in the Dow Jones. From its November low the Dow Jones rose by 15.68% to reach a high of 30091. The move towards the new all-time high occurred on the news of the Pfizer COVID-19 vaccine on November 9. This week, on the news of Moderna adding a good functioning COVID-19 vaccine candidate, the Dow Jones attempted to trade higher, but the index failed to trade above the November 9 high.

    I think the lack of follow-through is due to the market being short-term overbought. It could also be a case of the markets having successfully priced in an end to the COVID-19 crisis. I personally think that there is more upside to the markets but I would not be a buyer at current levels as too much of the good news has been priced in.


    Dow Jones technical analysis

    The Dow Jones remains in an upward trend and will continue to do so as long as the index trades above the 28594 level, this level is just below the November 12 low at 28916. As the price trend is upwards, I think traders will be happy to buy in the 28594 to 29229.8 interval.

    If the Dow Jones indeed bounces from the above-mentioned interval I think we might see a retest of the all-time high at 30091. However, a break to the 28594 levels will probably end the very short-term trend and could send the Dow to 28,000, followed by the 61.8% Fibonacci correction level at 27602. The Fibonacci levels are derived using the November low and the all-high.

    What is your take on the Dow Jones? Interact with Alex via Twitter @AlexFX00.


    How to trade indices with ATFX

    Looking to trade the world’s main Indices on an award-winning MT4 platform? Sign up for a live or demo account with ATFX to get up to speed. Start trading now to benefit from our highly competitive spreads on indices.

    1. Register for an account or log in to your existing account

    2. Open MT4 either on your desktop or mobile

    3. Search for Dow Jones in the market watch or symbols window

    4. Choose your position size

    5. Hit buy or sell, and then confirm the trade


    Dow Jones Four-hour chart

    Four-hour chart showing Dow Jones level since November 12 low at 28916 and until now

    To see all upcoming news and data releases that’ll have an effect on the financial markets, check out our Economic Calendar. It’ll cover all major releases from global economies and give you the exact time the release is due, the previous data, forecast data and actual data (once released).

    Last Updated: 17/11/2020

    This market commentary and analysis has been prepared for ATFX by a third party for general information purposes only. Any view expressed does not constitute a personal recommendation or solicitation to buy or sell as it does not take into account your personal circumstances or objectives, and should therefore not be interpreted as financial, investment or other advice, or relied upon as such. You should therefore seek independent advice before making any investment decisions. This information has not been prepared in accordance with legal requirements designed to promote the independence of investment research and as such is considered to be a marketing communication. Although we are not specifically constrained from dealing ahead of our recommendations we do not seek to take advantage of them before they are provided to our clients. We aim to establish and maintain and operate effective organisational and administrative arrangements with a view to taking all reasonable steps to prevent conflicts of interest from constituting or giving rise to a material risk of damage to the interests of our clients. The market data is derived from independent sources believed to be reliable, however we make no representation or warranty of its accuracy or completeness, and accept no responsibility for any consequence of its use by recipients. Reproduction of this information, in whole or in part, is not permitted.


    Recent news

    Recent news
    German Stocks Warn of a Potential High as Economy Falters

    A collection of headwinds could hurt German stocks. GER30 – Weekly Chart The German stock ...

    Recent news
    Bitcoin Hits Resistance as Debt Ceiling Deal Nears

    Bitcoin has hit another resistance level as the US nears a debt ceiling deal. BTCUSD – Dai...

    Recent news
    US Stocks Face Important Week with Debt Deal in the Balance

    The US30 has dropped through support after Germany's disappointing GDP growth print. US30 ...

    Recent news
    EURGBP in Focus with European Economic Data

    The price of EURGBP could see volatility as the pair has European economic data released. ...

    Recent news
    US Dollar Index Softens Ahead Of Key Data Release This Week

    On Tuesday, the US dollar paused at 104.51, soft against a basket of major currencies but ...