Tech Rebound Lifts Wall Street, Markets Brace for Earnings Wave

Key Takeaways

  • US technology shares recovered on Monday, lifting the Nasdaq and S&P 500, while the Dow edged lower.
  • Treasury yields and the Dollar Index rose, and gold declined.
  • Middle East supply risks kept oil prices elevated, with Brent and WTI moving in opposite directions.
  • China left its one-year and five-year loan prime rates unchanged at 3.00% and 3.50%.
  • Markets are assessing the lower UK unemployment rate alongside corporate earnings, ahead of Wednesday’s UK inflation release.

Today’s Focus: The UK August unemployment rate fell to 4.7%, below the 5.0% forecast and the previous reading of 4.9%. Employment and wage details may influence expectations for the BoE’s November decision ahead of Wednesday’s CPI report. Germany’s PPI, euro-area ZEW sentiment, US weekly ADP employment and housing data are also scheduled. GM reports today, with major technology results later this week. Oil traders will monitor developments in Hormuz, inventories, and Wednesday’s November crude contract expiry.


Global Market Review 20/10/2026

  • Monday’s US cash session: the Dow declined 0.07% to 51,966, the S&P 500 gained 0.41% to 7,690, and the Nasdaq Composite rose 1.11% to 26,430.
  • The Dollar Index increased 0.19% to 101.97.
  • The 2-year Treasury yield rose 6.4 basis points to 4.772%, while the 10-year increased 6.7 basis points to 5.140%.
  • Brent declined 0.53% to $109.28, WTI rose 2.06% to $103.50, and gold fell 0.61% to $4,139.67.


Economic Calendar

Key Events on October 20 (GMT+8)

Time (GMT+8)EventImportance
09:15CN 1Y & 5Y Loan Prime Rates OCT**
14:00Germany PPI YoY SEP**
14:00UK Unemployment Rate AUG (Actual: 4.7%; forecast: 5.0%; previous: 4.9%)**
17:00EU ZEW Economic Sentiment Index OCT**
20:15US ADP Weekly Employment Change**
20:30US Building Permits & Housing Starts SEP**

Key Events on October 21 (GMT+8)

  • NYMEX November Crude Oil Contract Expiry
Time (GMT+8)EventImportance
04:30US API Crude Oil Stock Change***
14:00UK CPI & PPI SEP***
21:00BoE Governor Bailey Speech***
22:30US EIA Crude Oil Stocks Change**


Markets Analysis 20/10/2026

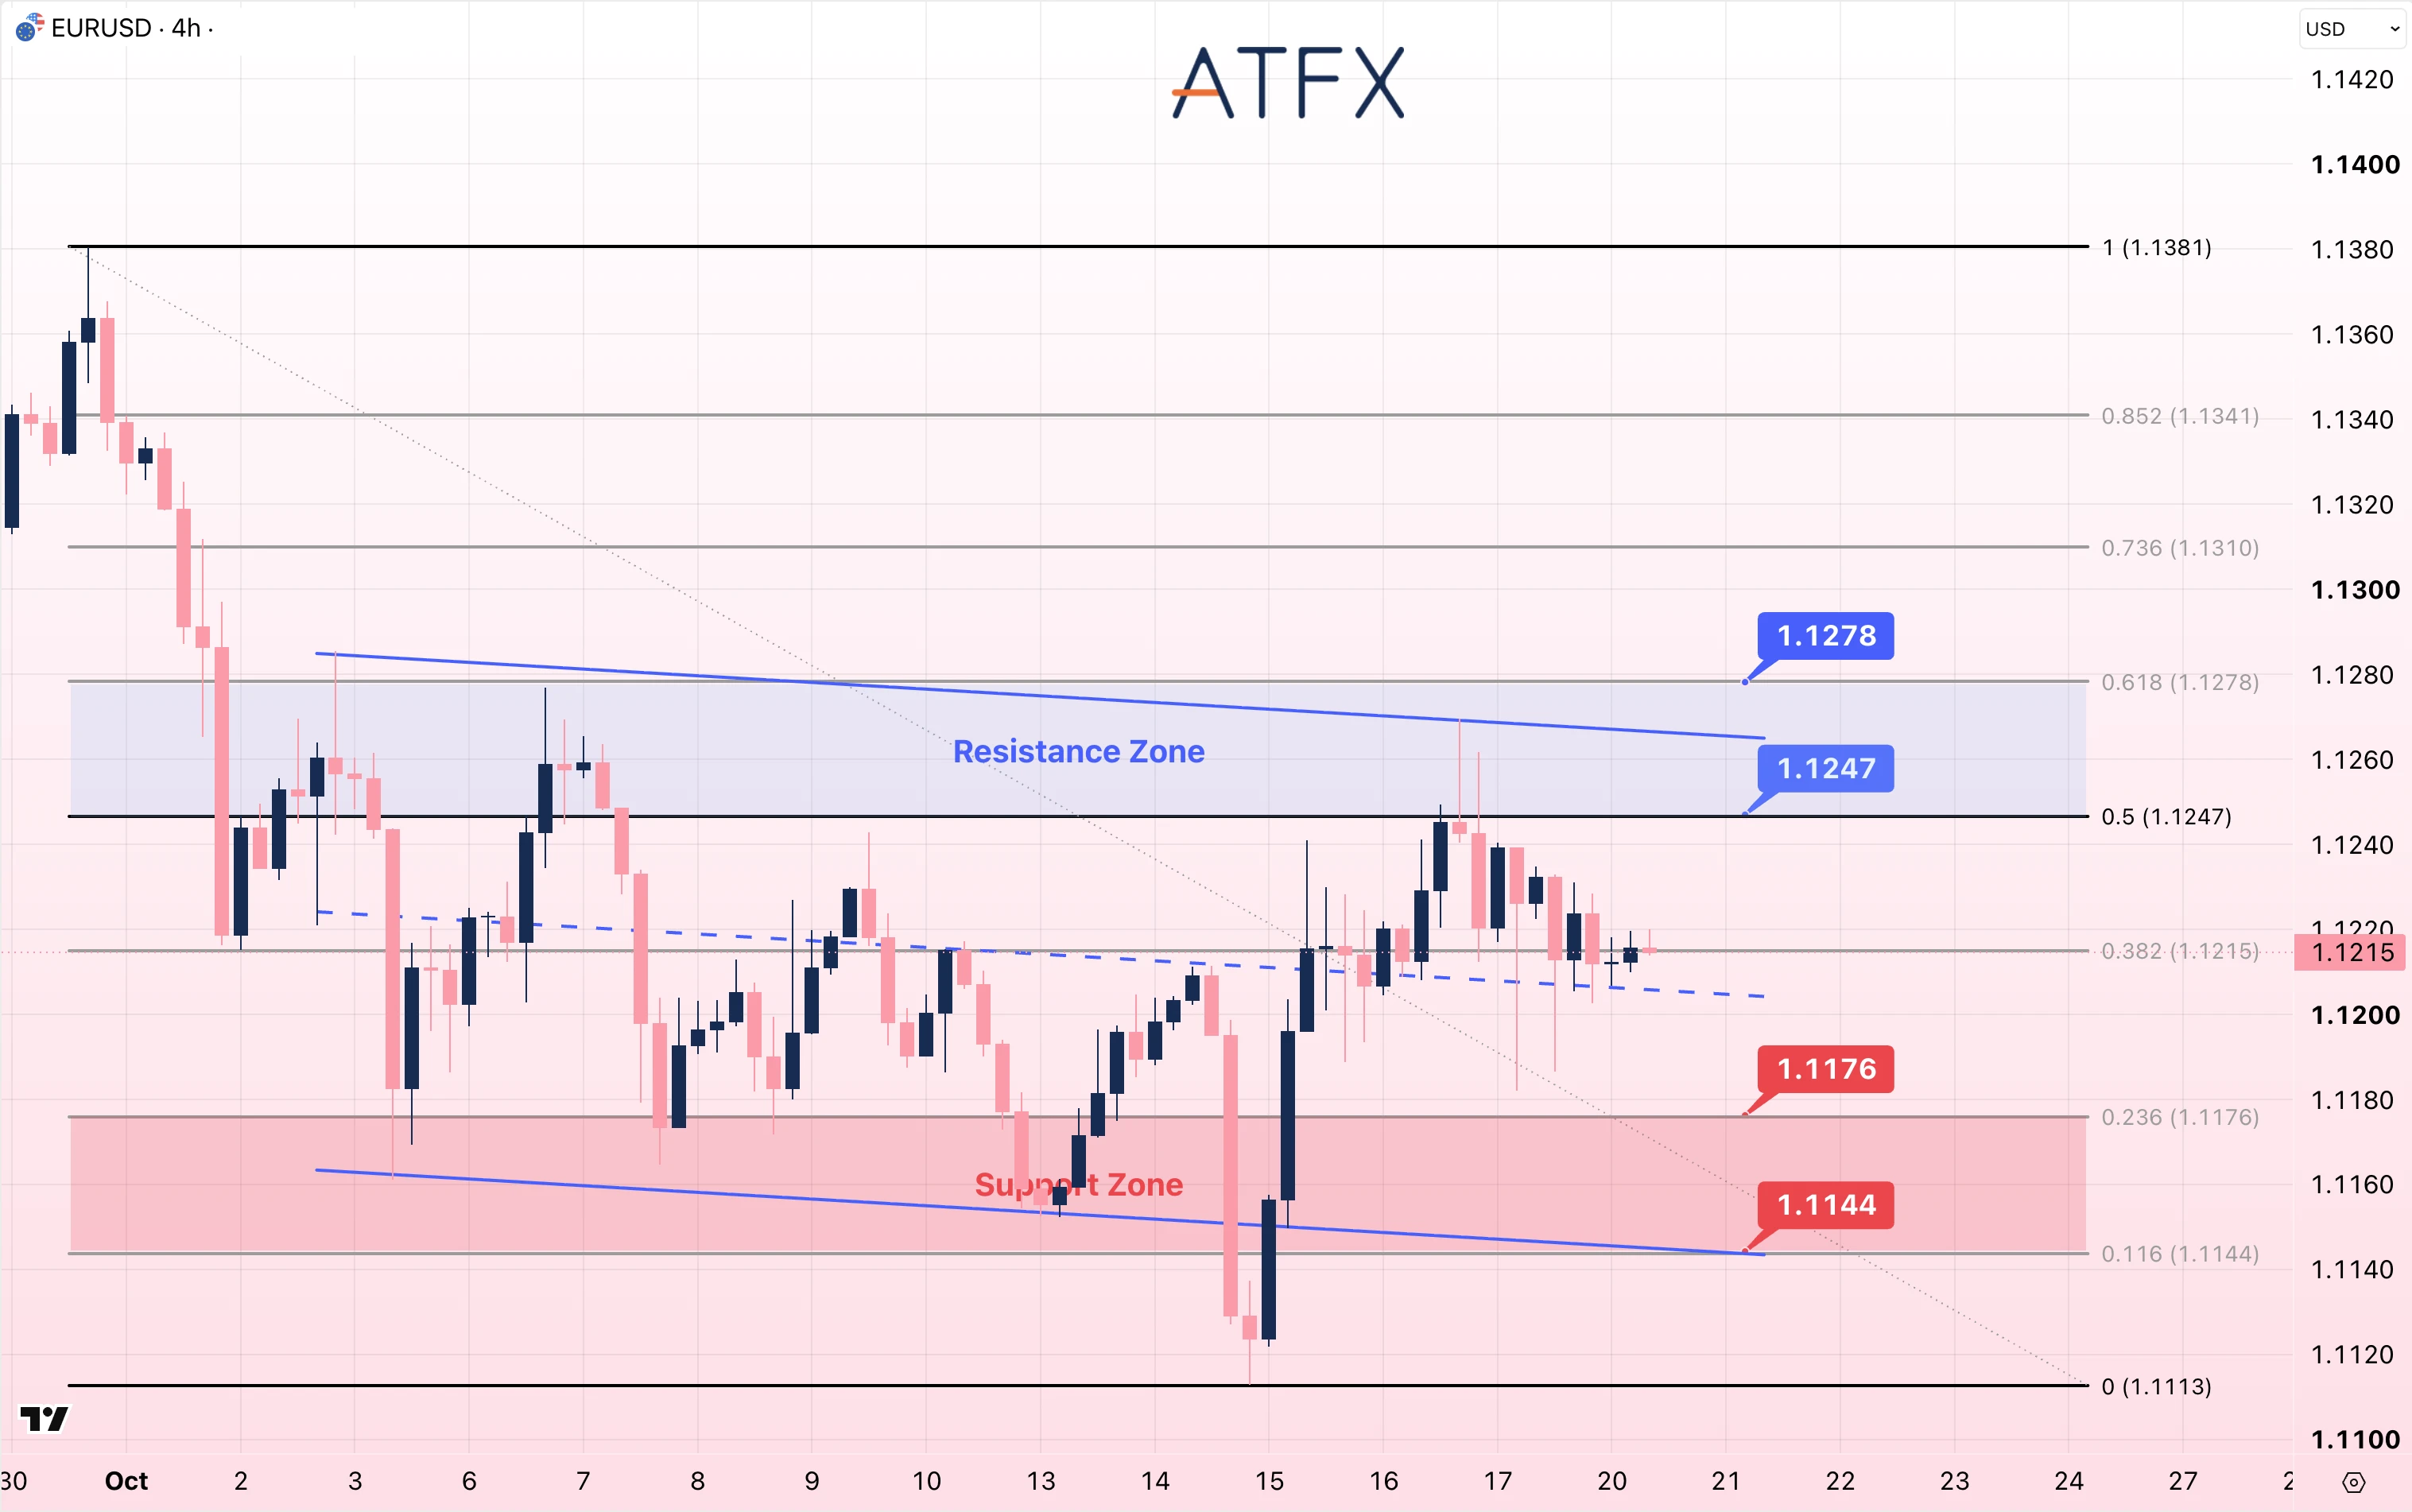
EURUSD chart for 20 October 2026 showing a cautiously bearish bias with key support at 1.1179 and resistance at 1.1260.

  • Resistance: 1.1247/1.1278
  • Support: 1.1176/1.1144

Analyst’s View: French fiscal and political uncertainty remains relevant to the Euro, while today’s ZEW survey may affect growth expectations. EUR/USD is near 1.1215, just above the descending channel’s midline after pulling back from 1.1260. A recovery above 1.1247 would bring 1.1278 into focus; below 1.1176, the next marked support is 1.1144.

Bias: Neutral to Cautiously Bearish
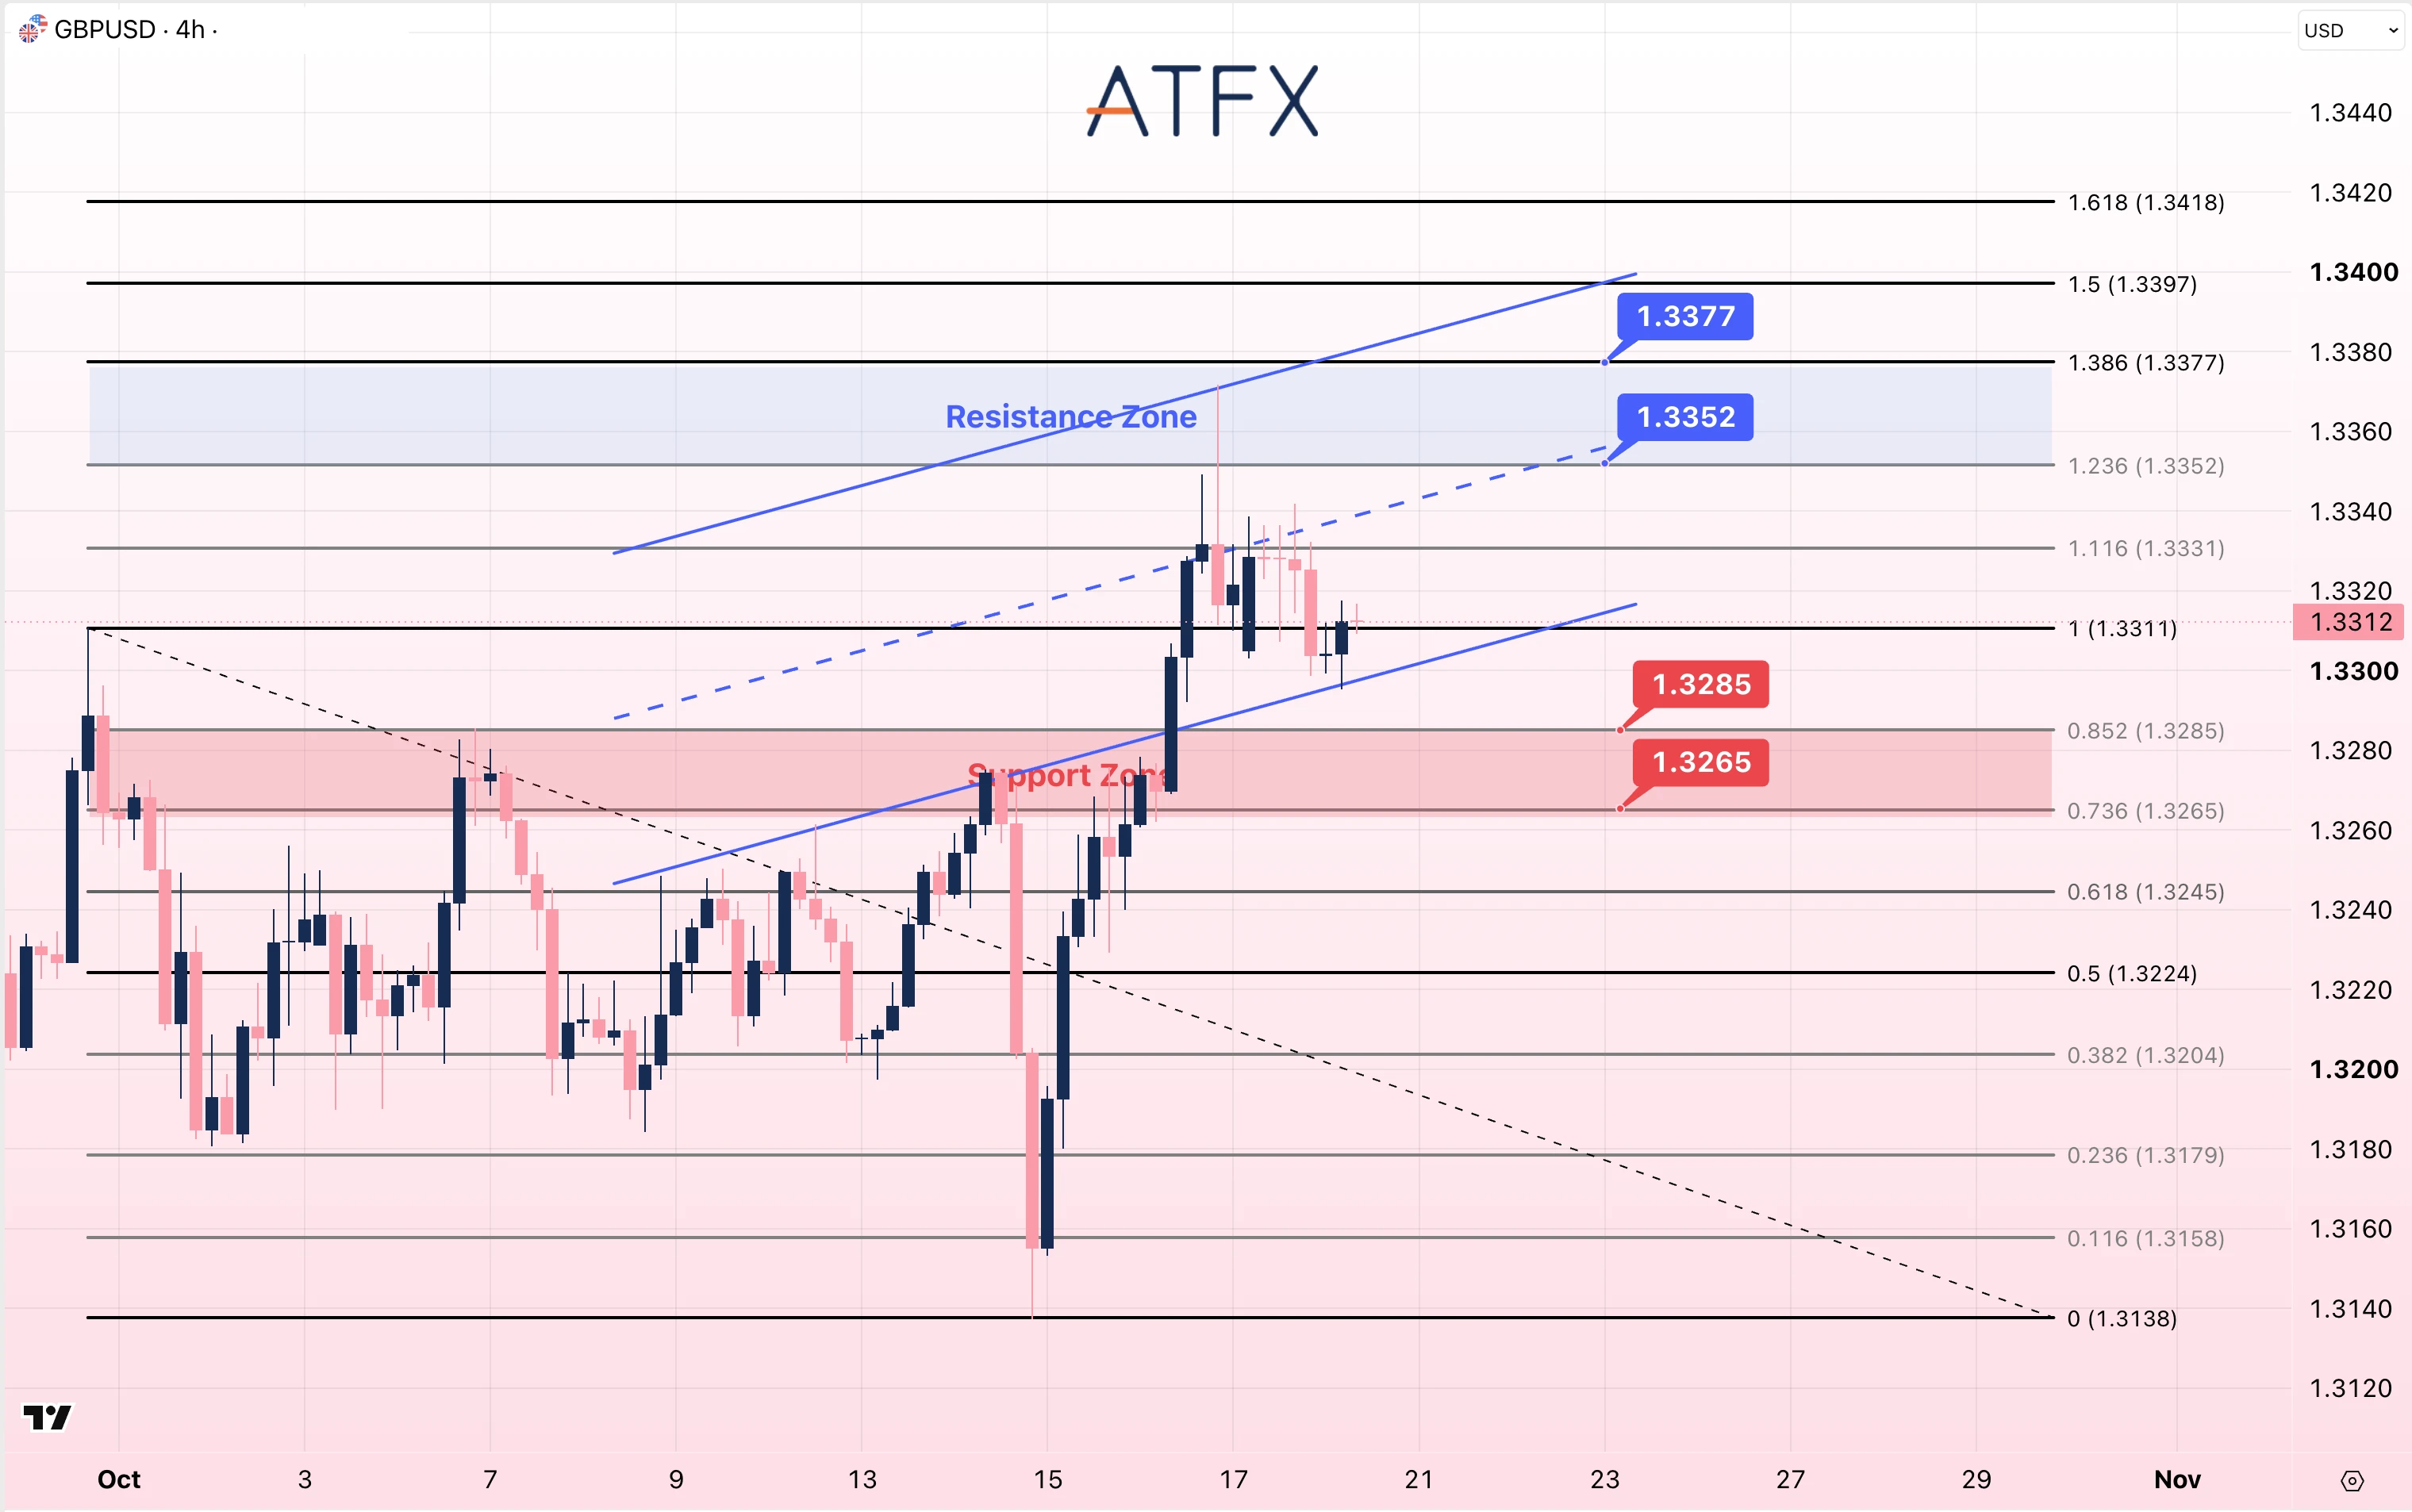
 

GBPUSD chart on 20 October 2026 displaying support at 1.3245 and resistance at 1.3311, with a neutral bias ahead of UK CPI.

  • Resistance: 1.3352/1.3377
  • Support: 1.3285/1.3265

Analyst’s View: UK August unemployment fell to 4.7%, below the 5.0% forecast and 4.9% previously. The lower reading may support BoE hike expectations ahead of Wednesday’s inflation report. GBP/USD is near 1.3312, around the 1.3311 pivot and near the lower boundary of the rising channel after retreating from 1.3370. A recovery above 1.3352 would bring 1.3377 into focus; below 1.3285, the next marked support is 1.3265.

Bias: Neutral Ahead of UK CPI
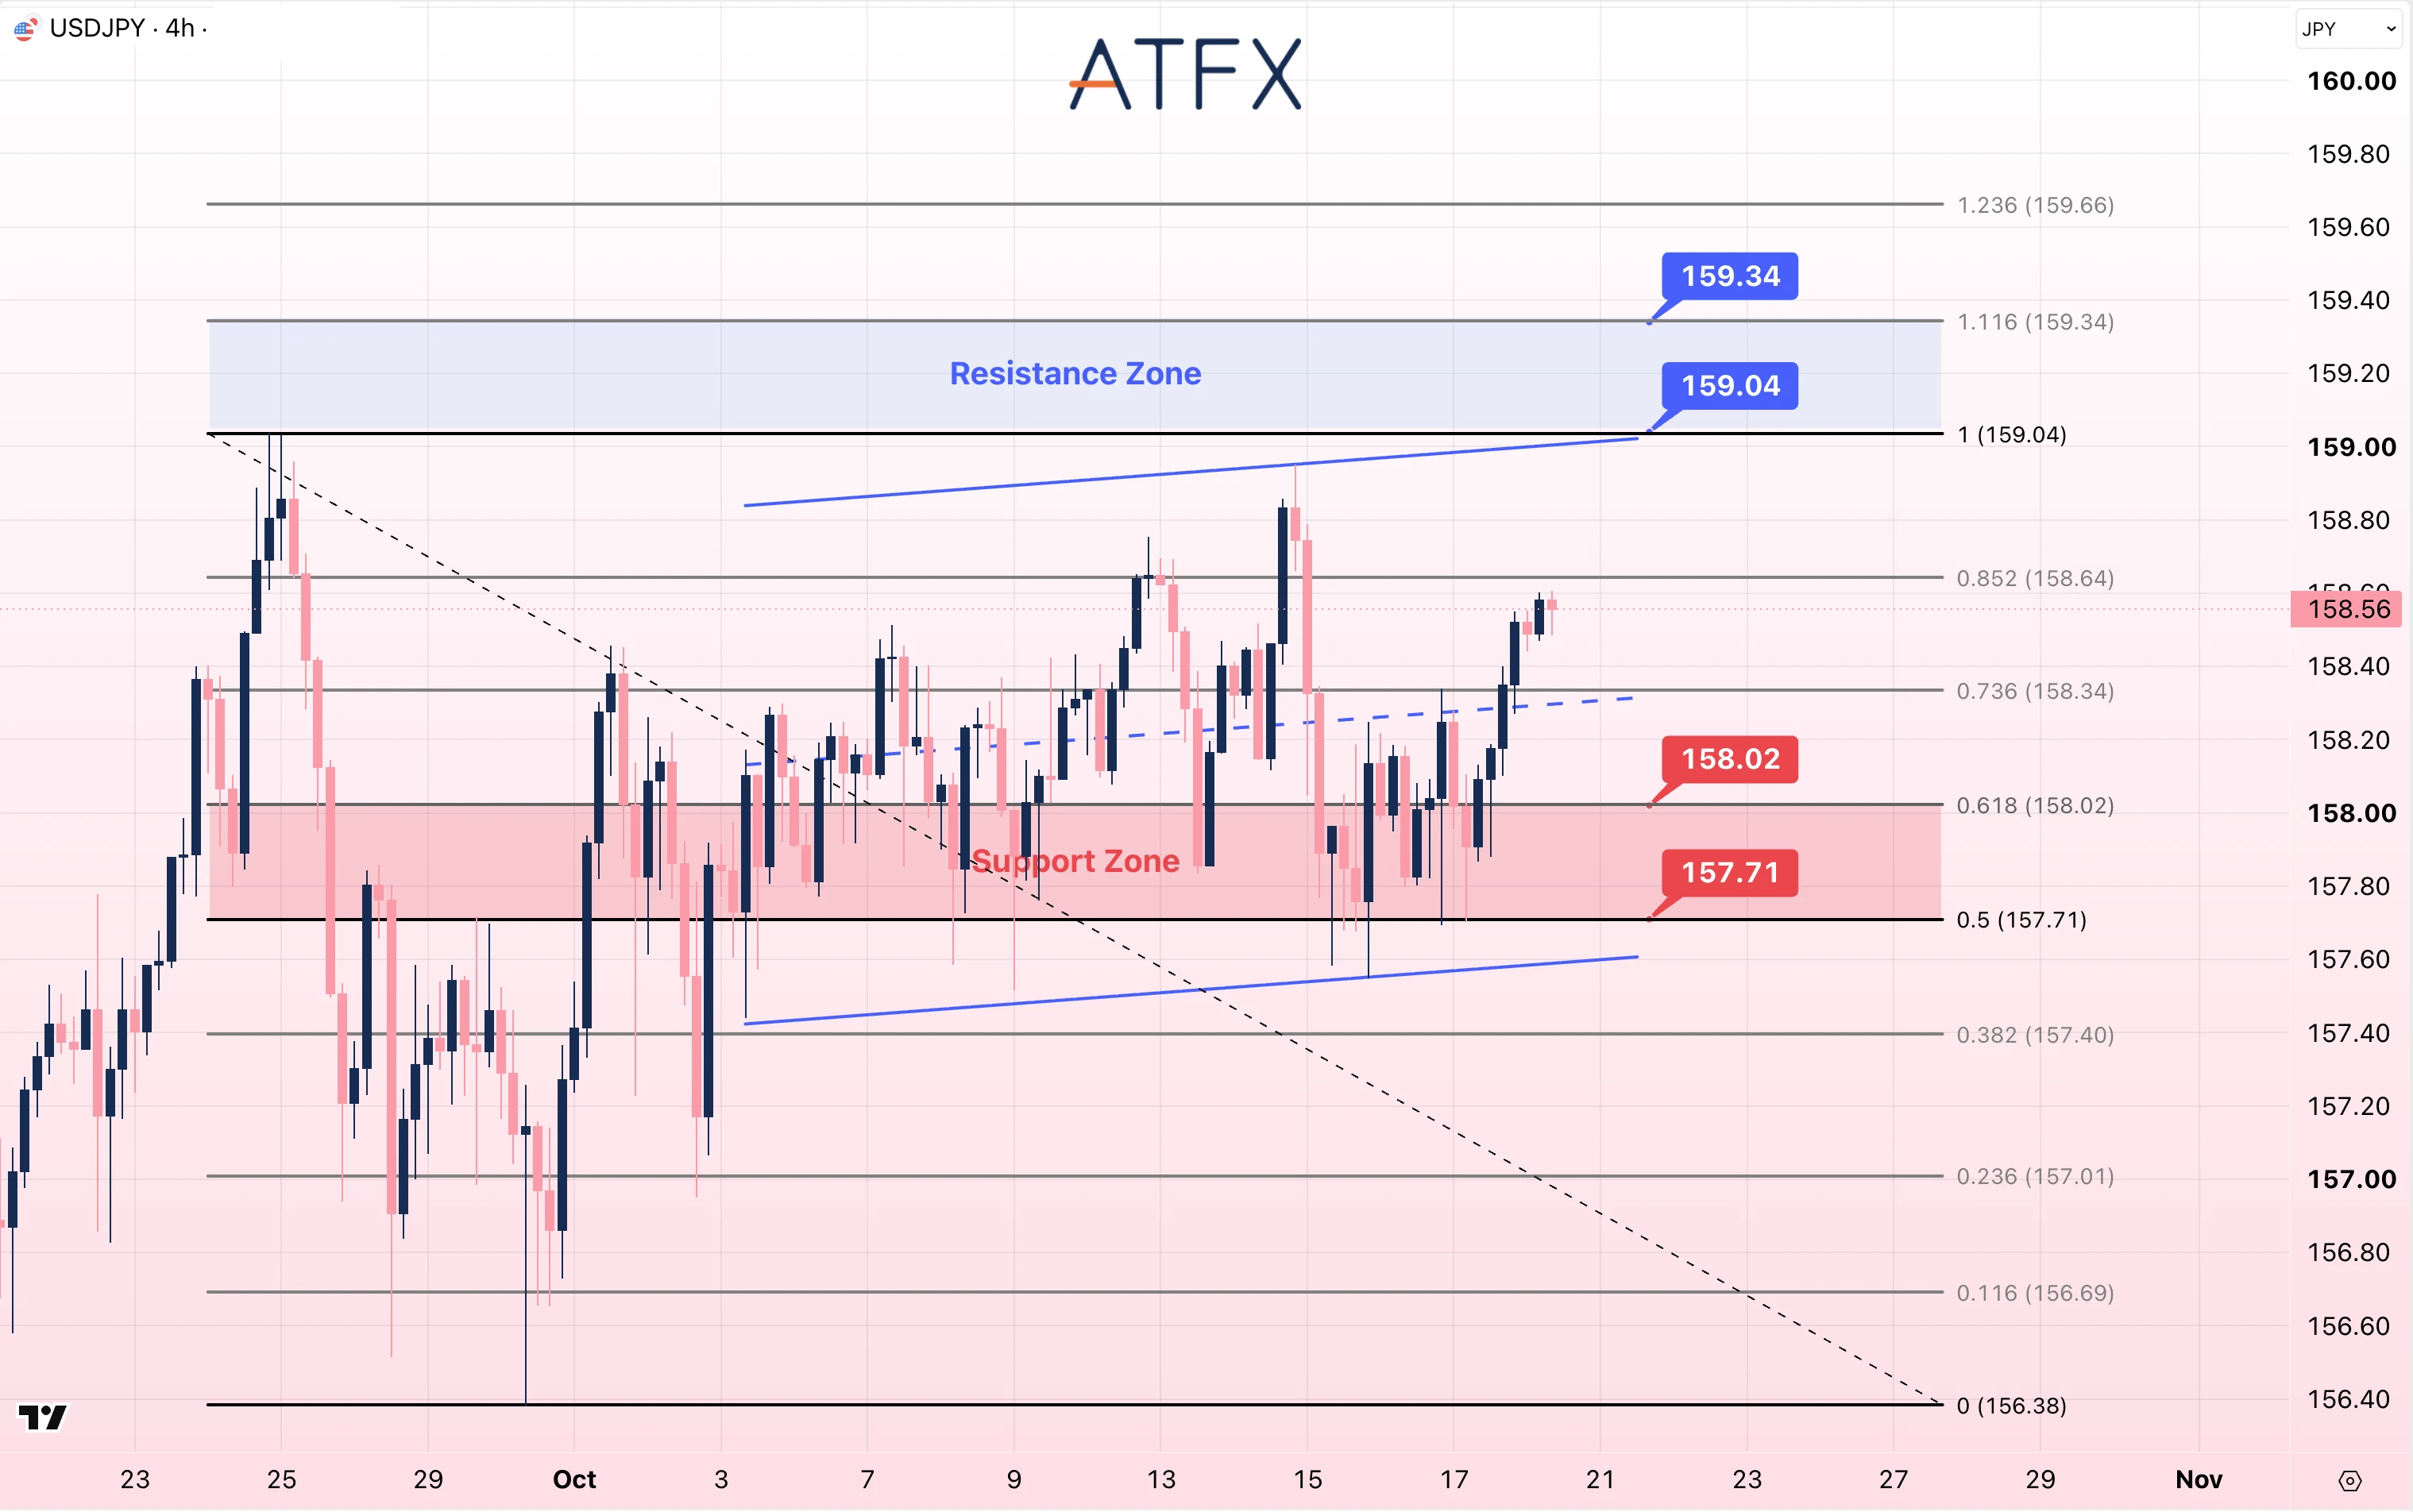
 

USDJPY chart on 20 October 2026 showing a cautiously bullish bias with support at 157.71 and resistance at 158.65.

  • Resistance: 159.04/159.34
  • Support: 158.02/157.71

Analyst’s View: Higher US Treasury yields support the Dollar’s interest-rate advantage, while Japan’s fiscal funding and BoJ policy remain in focus. USD/JPY is near 158.56, above the rising channel’s midline but below the 158.64 intermediate level. Above 159.04, the next marked resistance is 159.34; below 158.02, the next marked support is 157.71.

Bias: Cautiously Bullish
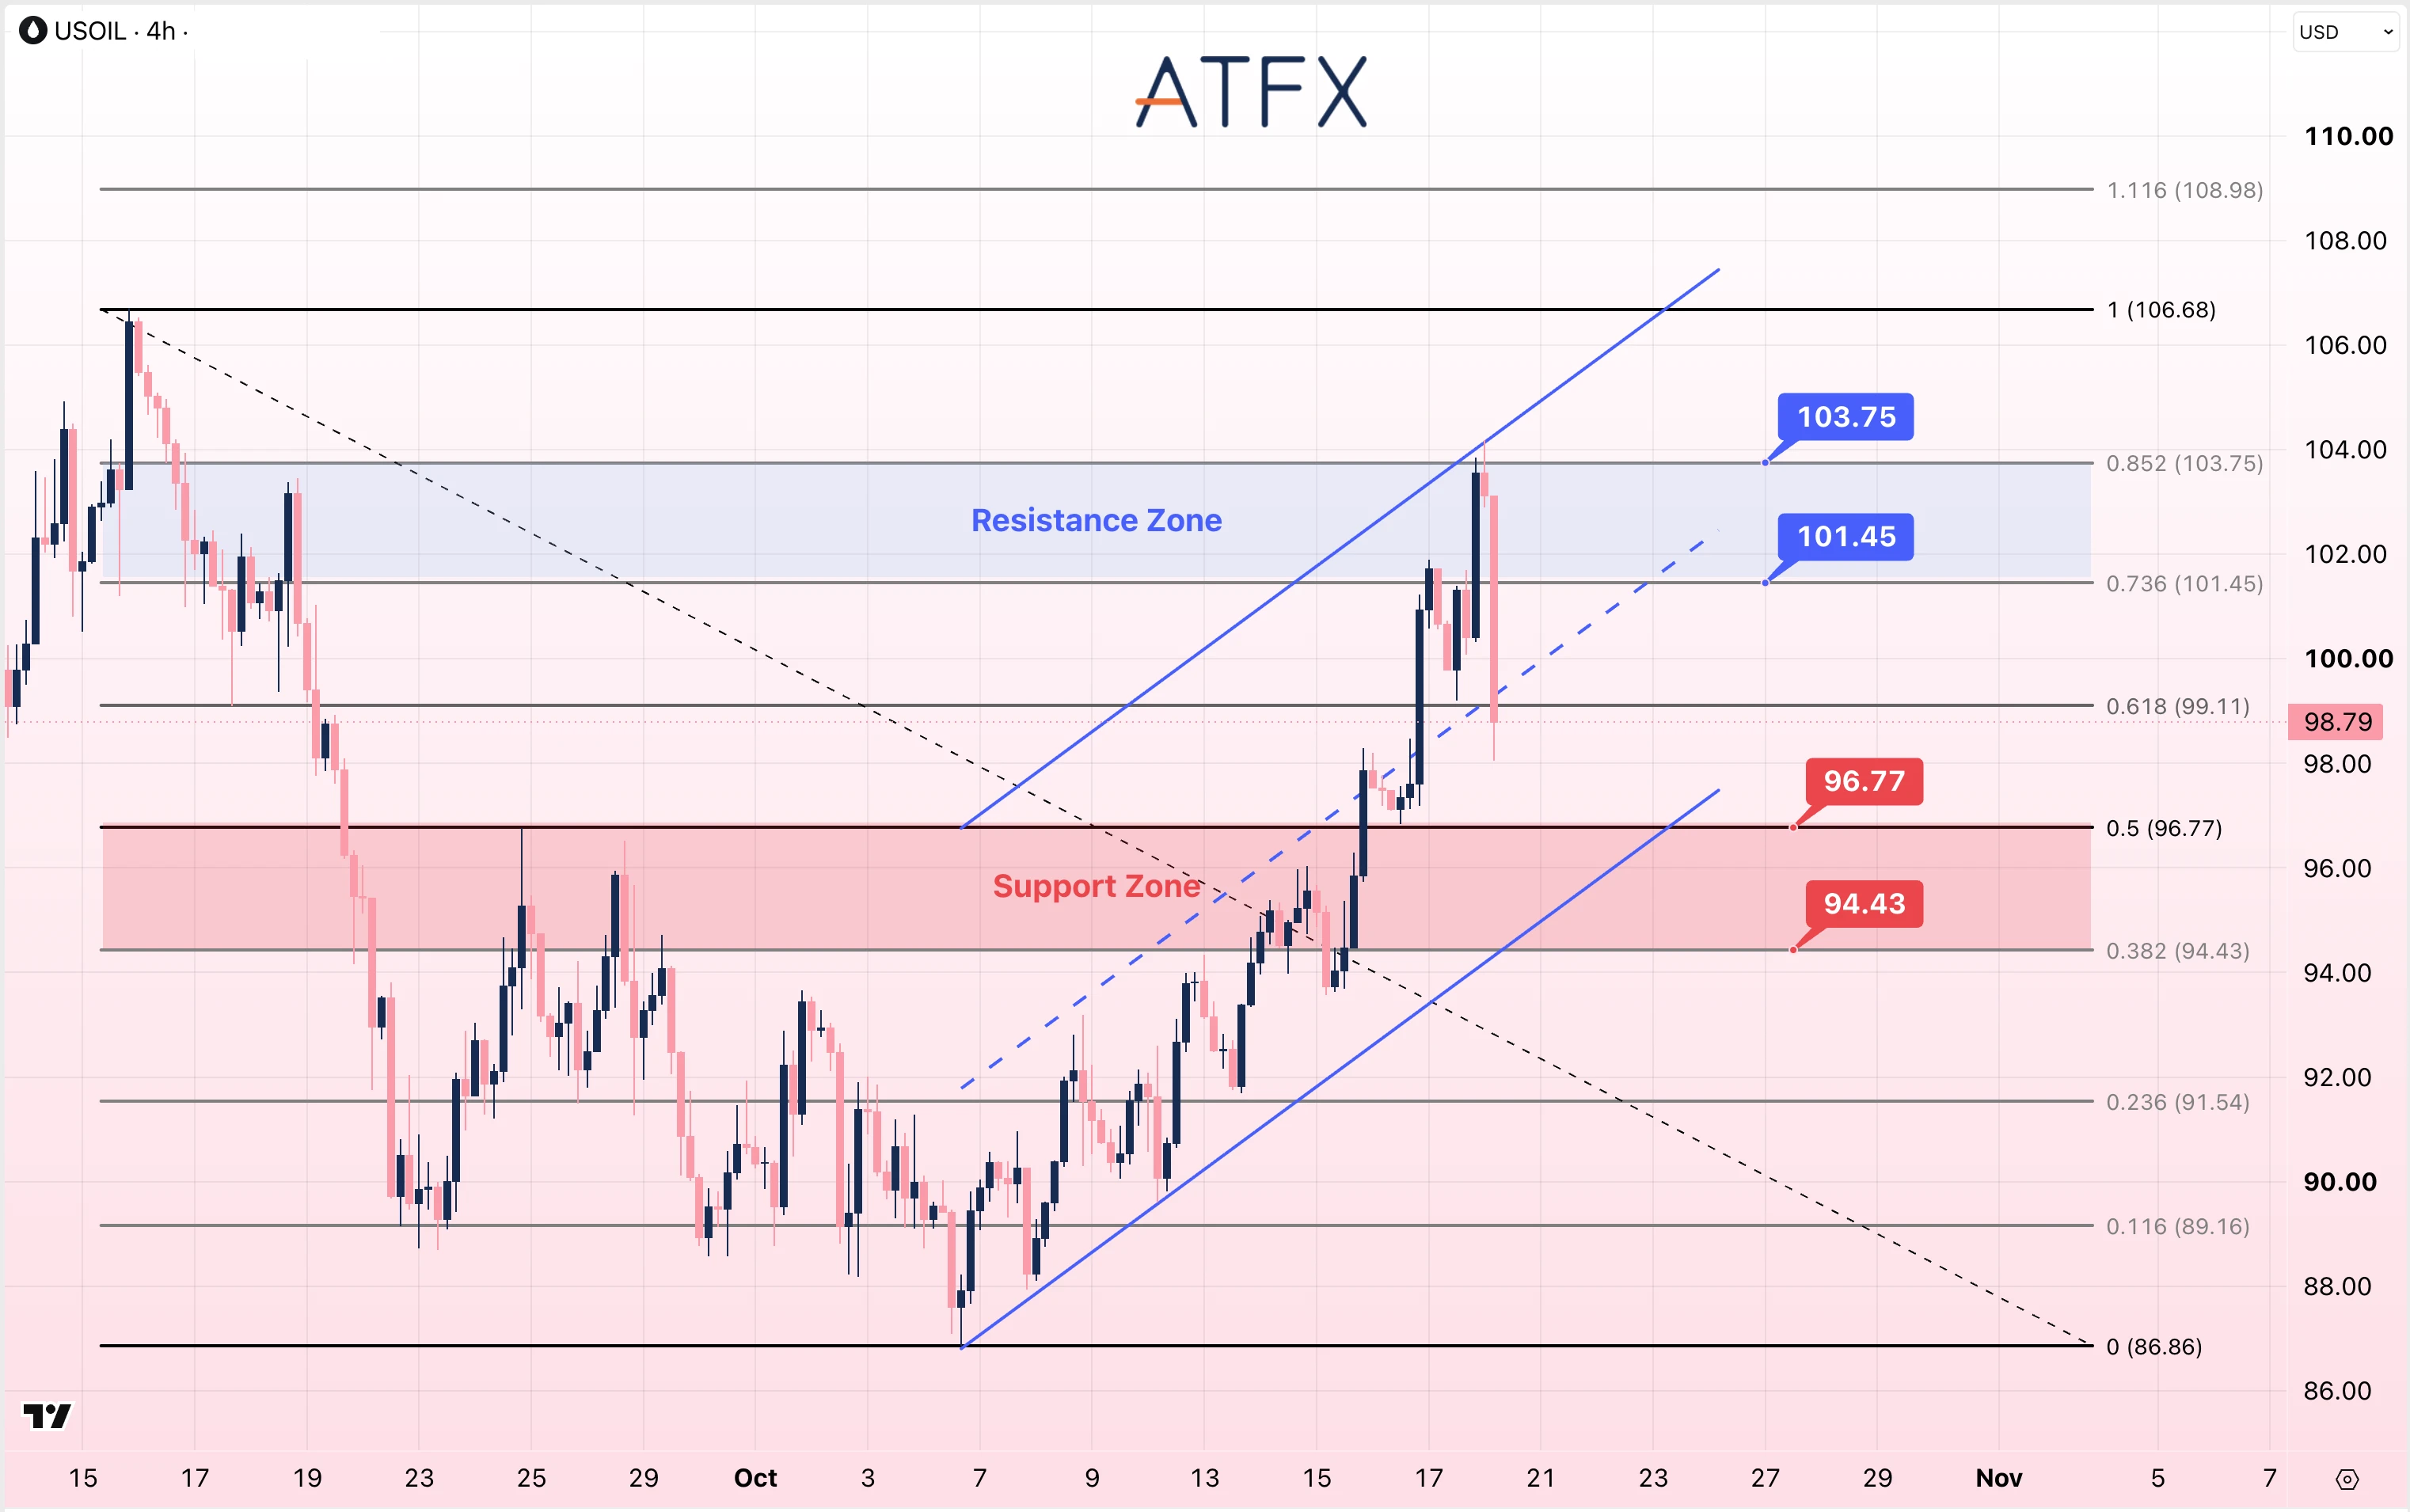
 

US Crude Oil Futures (OCT) chart for 20 October 2026 showing support at 95.29 and resistance at 99.12 with a neutral bias.

  • Resistance: 101.45/103.75
  • Support: 96.77/94.43

Analyst’s View: Hormuz attacks and Saudi supply risks remain relevant, with inventories and November contract expiry also in focus. The USOIL chart is near $98.79 after retreating from around $103.75, below the rising channel’s midline and the $99.11 Fibonacci level. Above $101.45, the next marked resistance is $103.75; below $96.77, the next marked support is $94.43.

Bias: Neutral to Cautiously Bearish
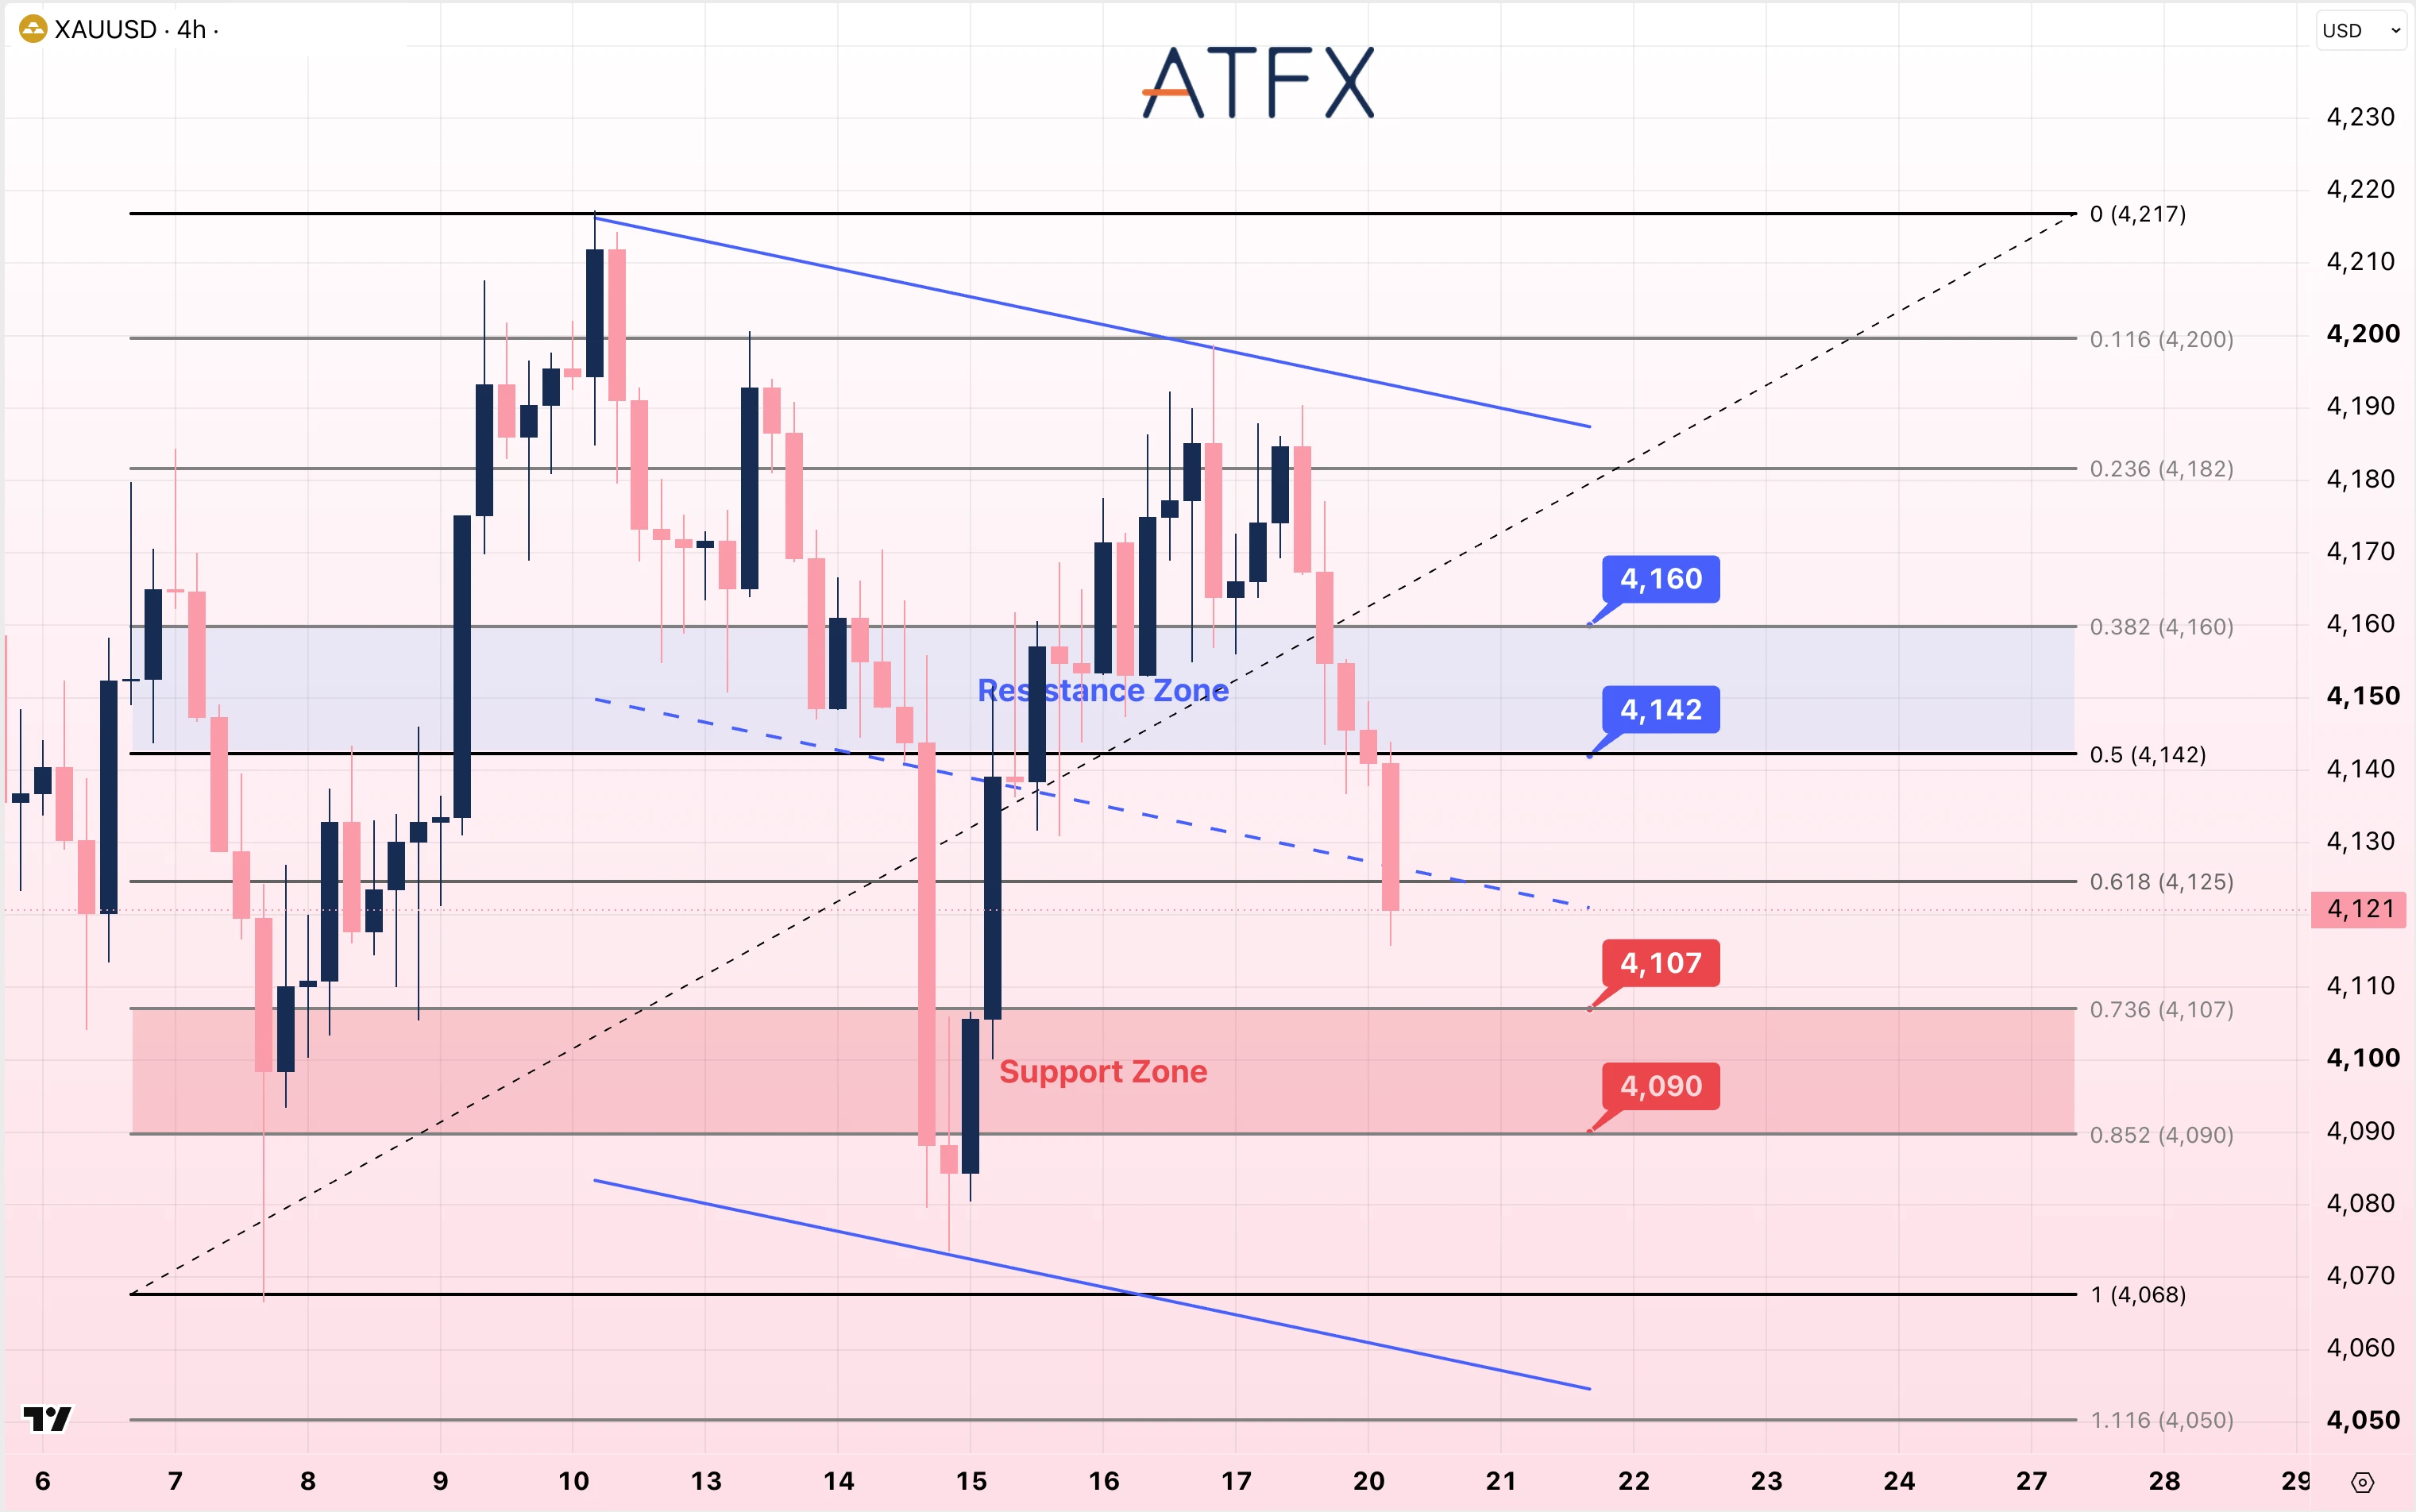
 

Spot Gold (XAU/USD) chart for 20 October 2026 with support at 4,096 and resistance at 4,191, biased cautiously bearish.

  • Resistance: 4142/4160
  • Support: 4107/4090


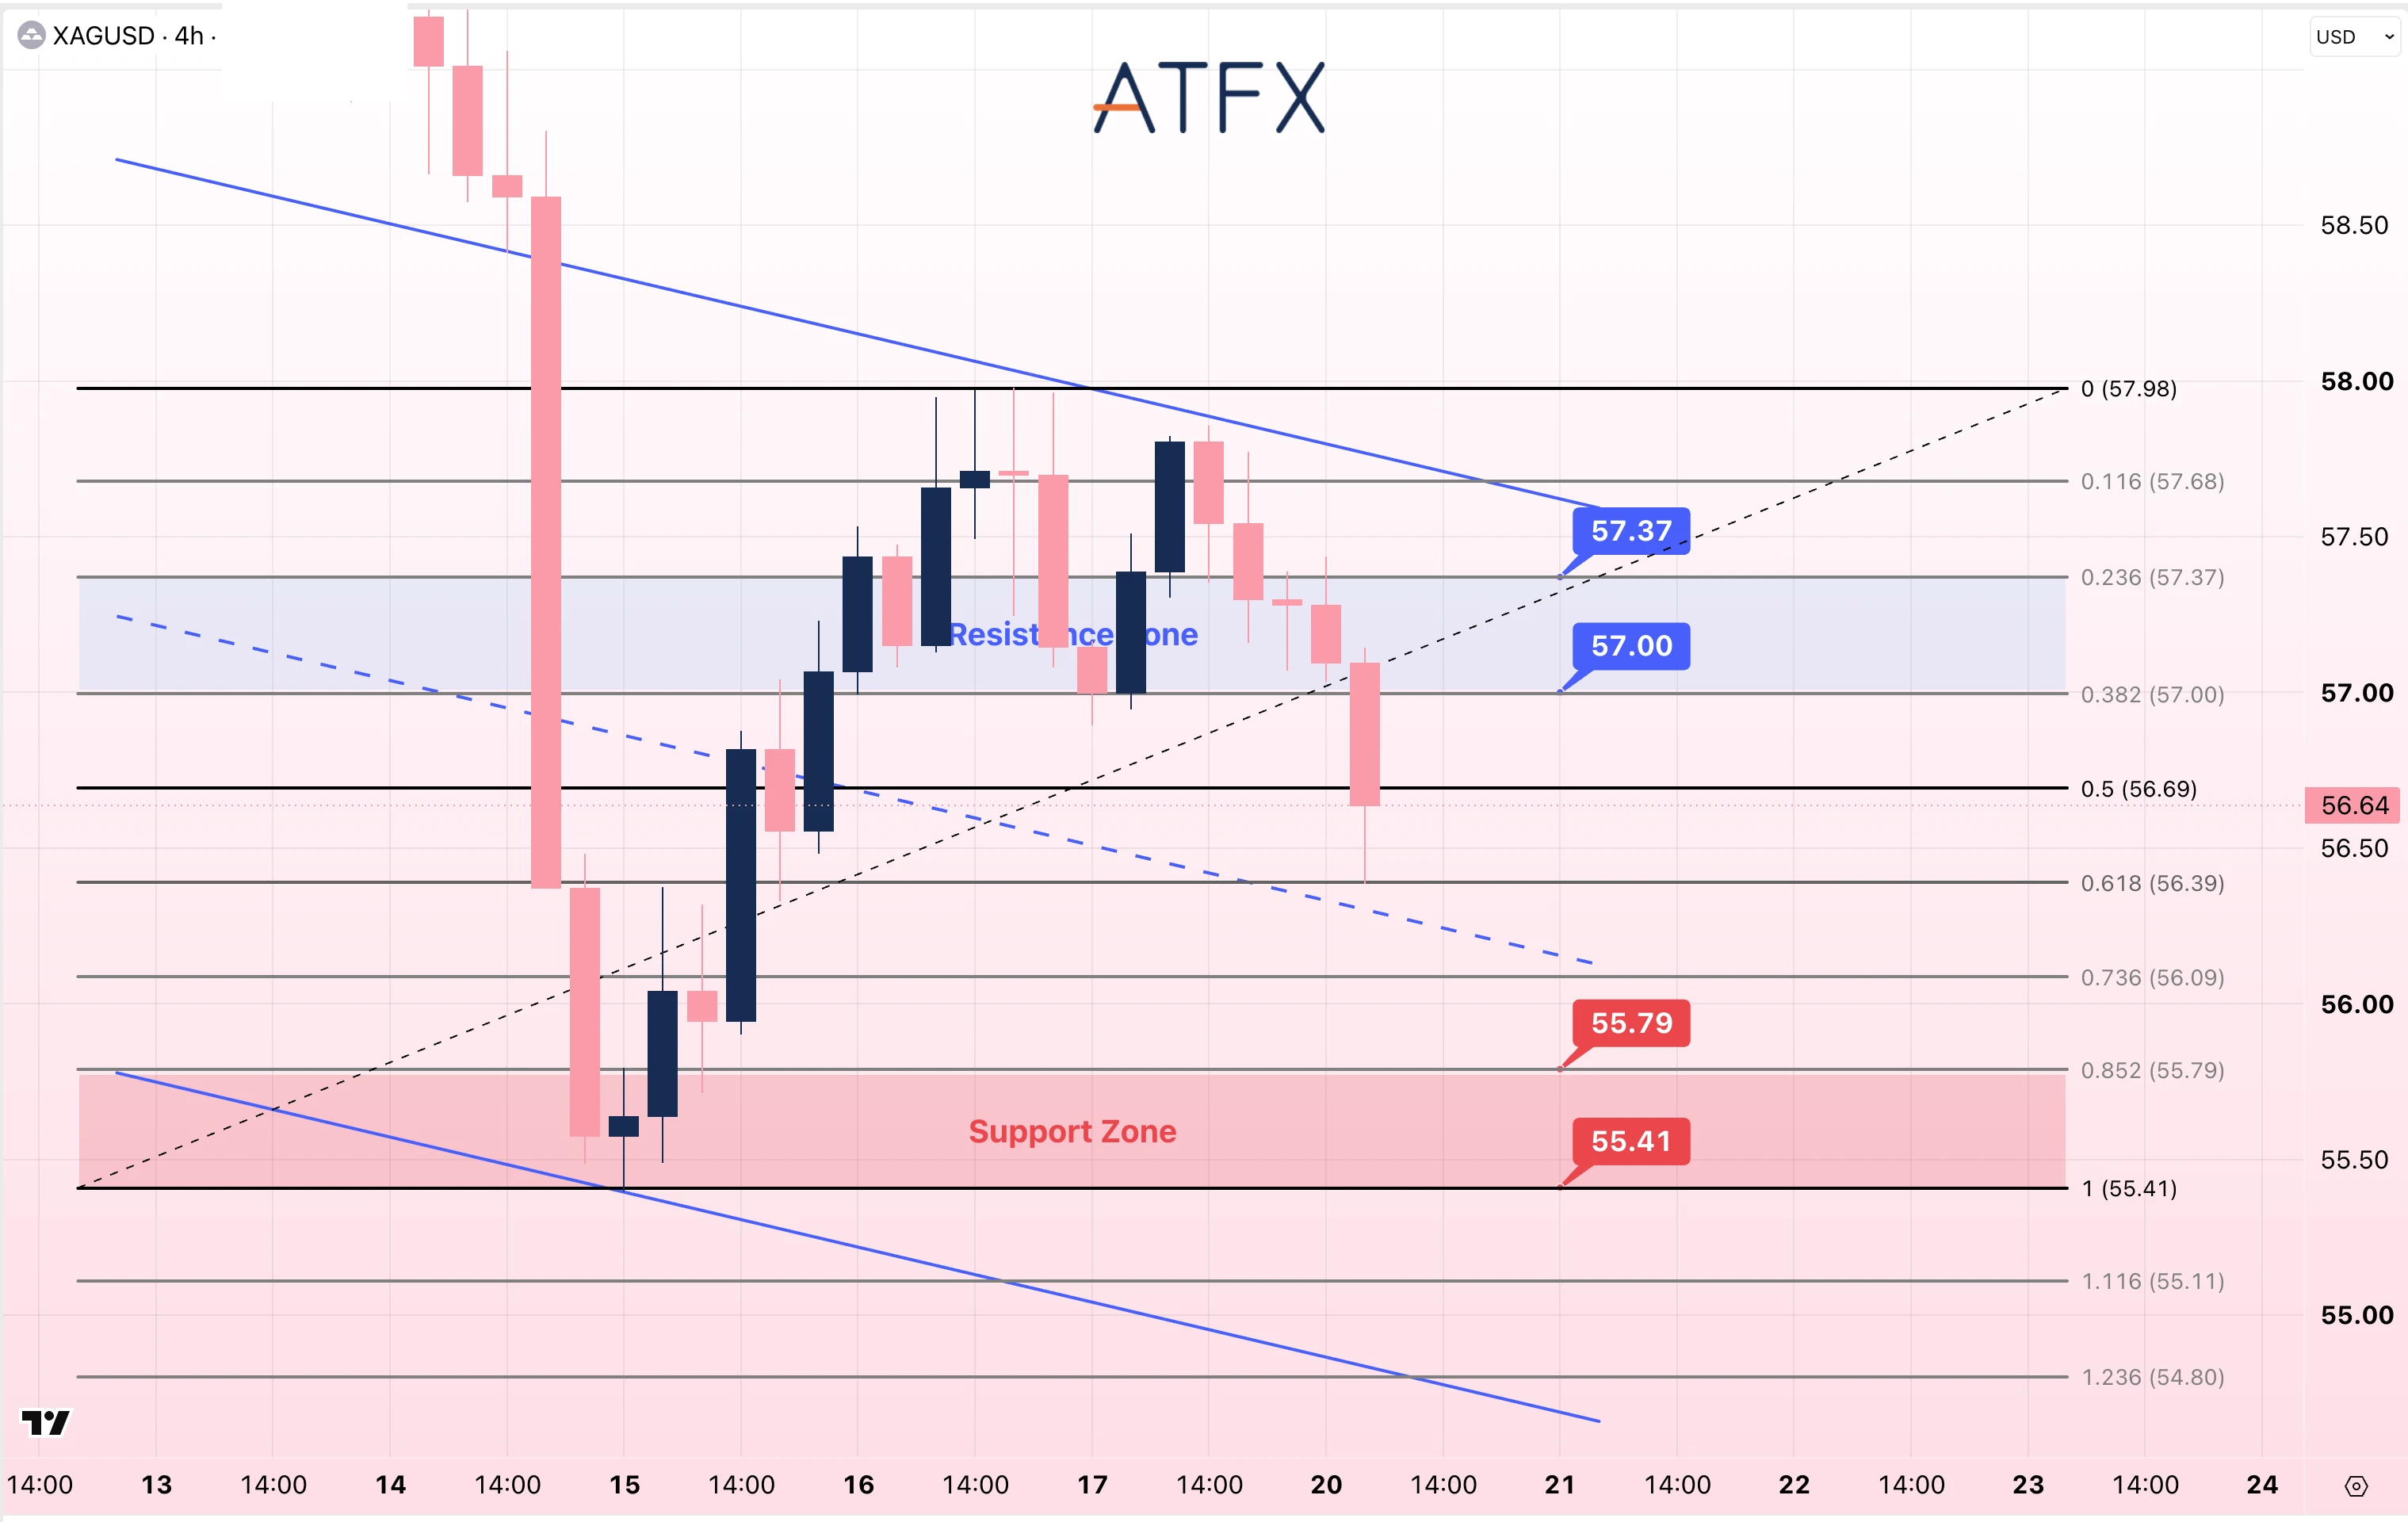
Spot Silver (XAG/USD) chart for 20 October 2026 with support at 56.18 and resistance at 58.75, biased cautiously bearish.

  • Resistance: 57.00/57.37
  • Support: 55.79/55.41

Analyst’s View: Higher Treasury yields increase the opportunity cost of holding gold, while energy prices remain relevant to inflation and Fed expectations. Gold is near $4,121, below the descending channel’s midline and the $4,125 Fibonacci level. Above $4,142, the next marked resistance is $4,160; below $4,107, the next marked support is $4,090.

Higher yields also weigh on silver, while China’s growth data inform expectations for industrial demand. Silver is near $56.64 after falling below $57.00 and the $56.69 Fibonacci level. A recovery above $57.00 would bring $57.37 into focus; below $55.79, the next marked support is $55.41.

Bias: Gold Cautiously Bearish; Silver Cautiously Bearish
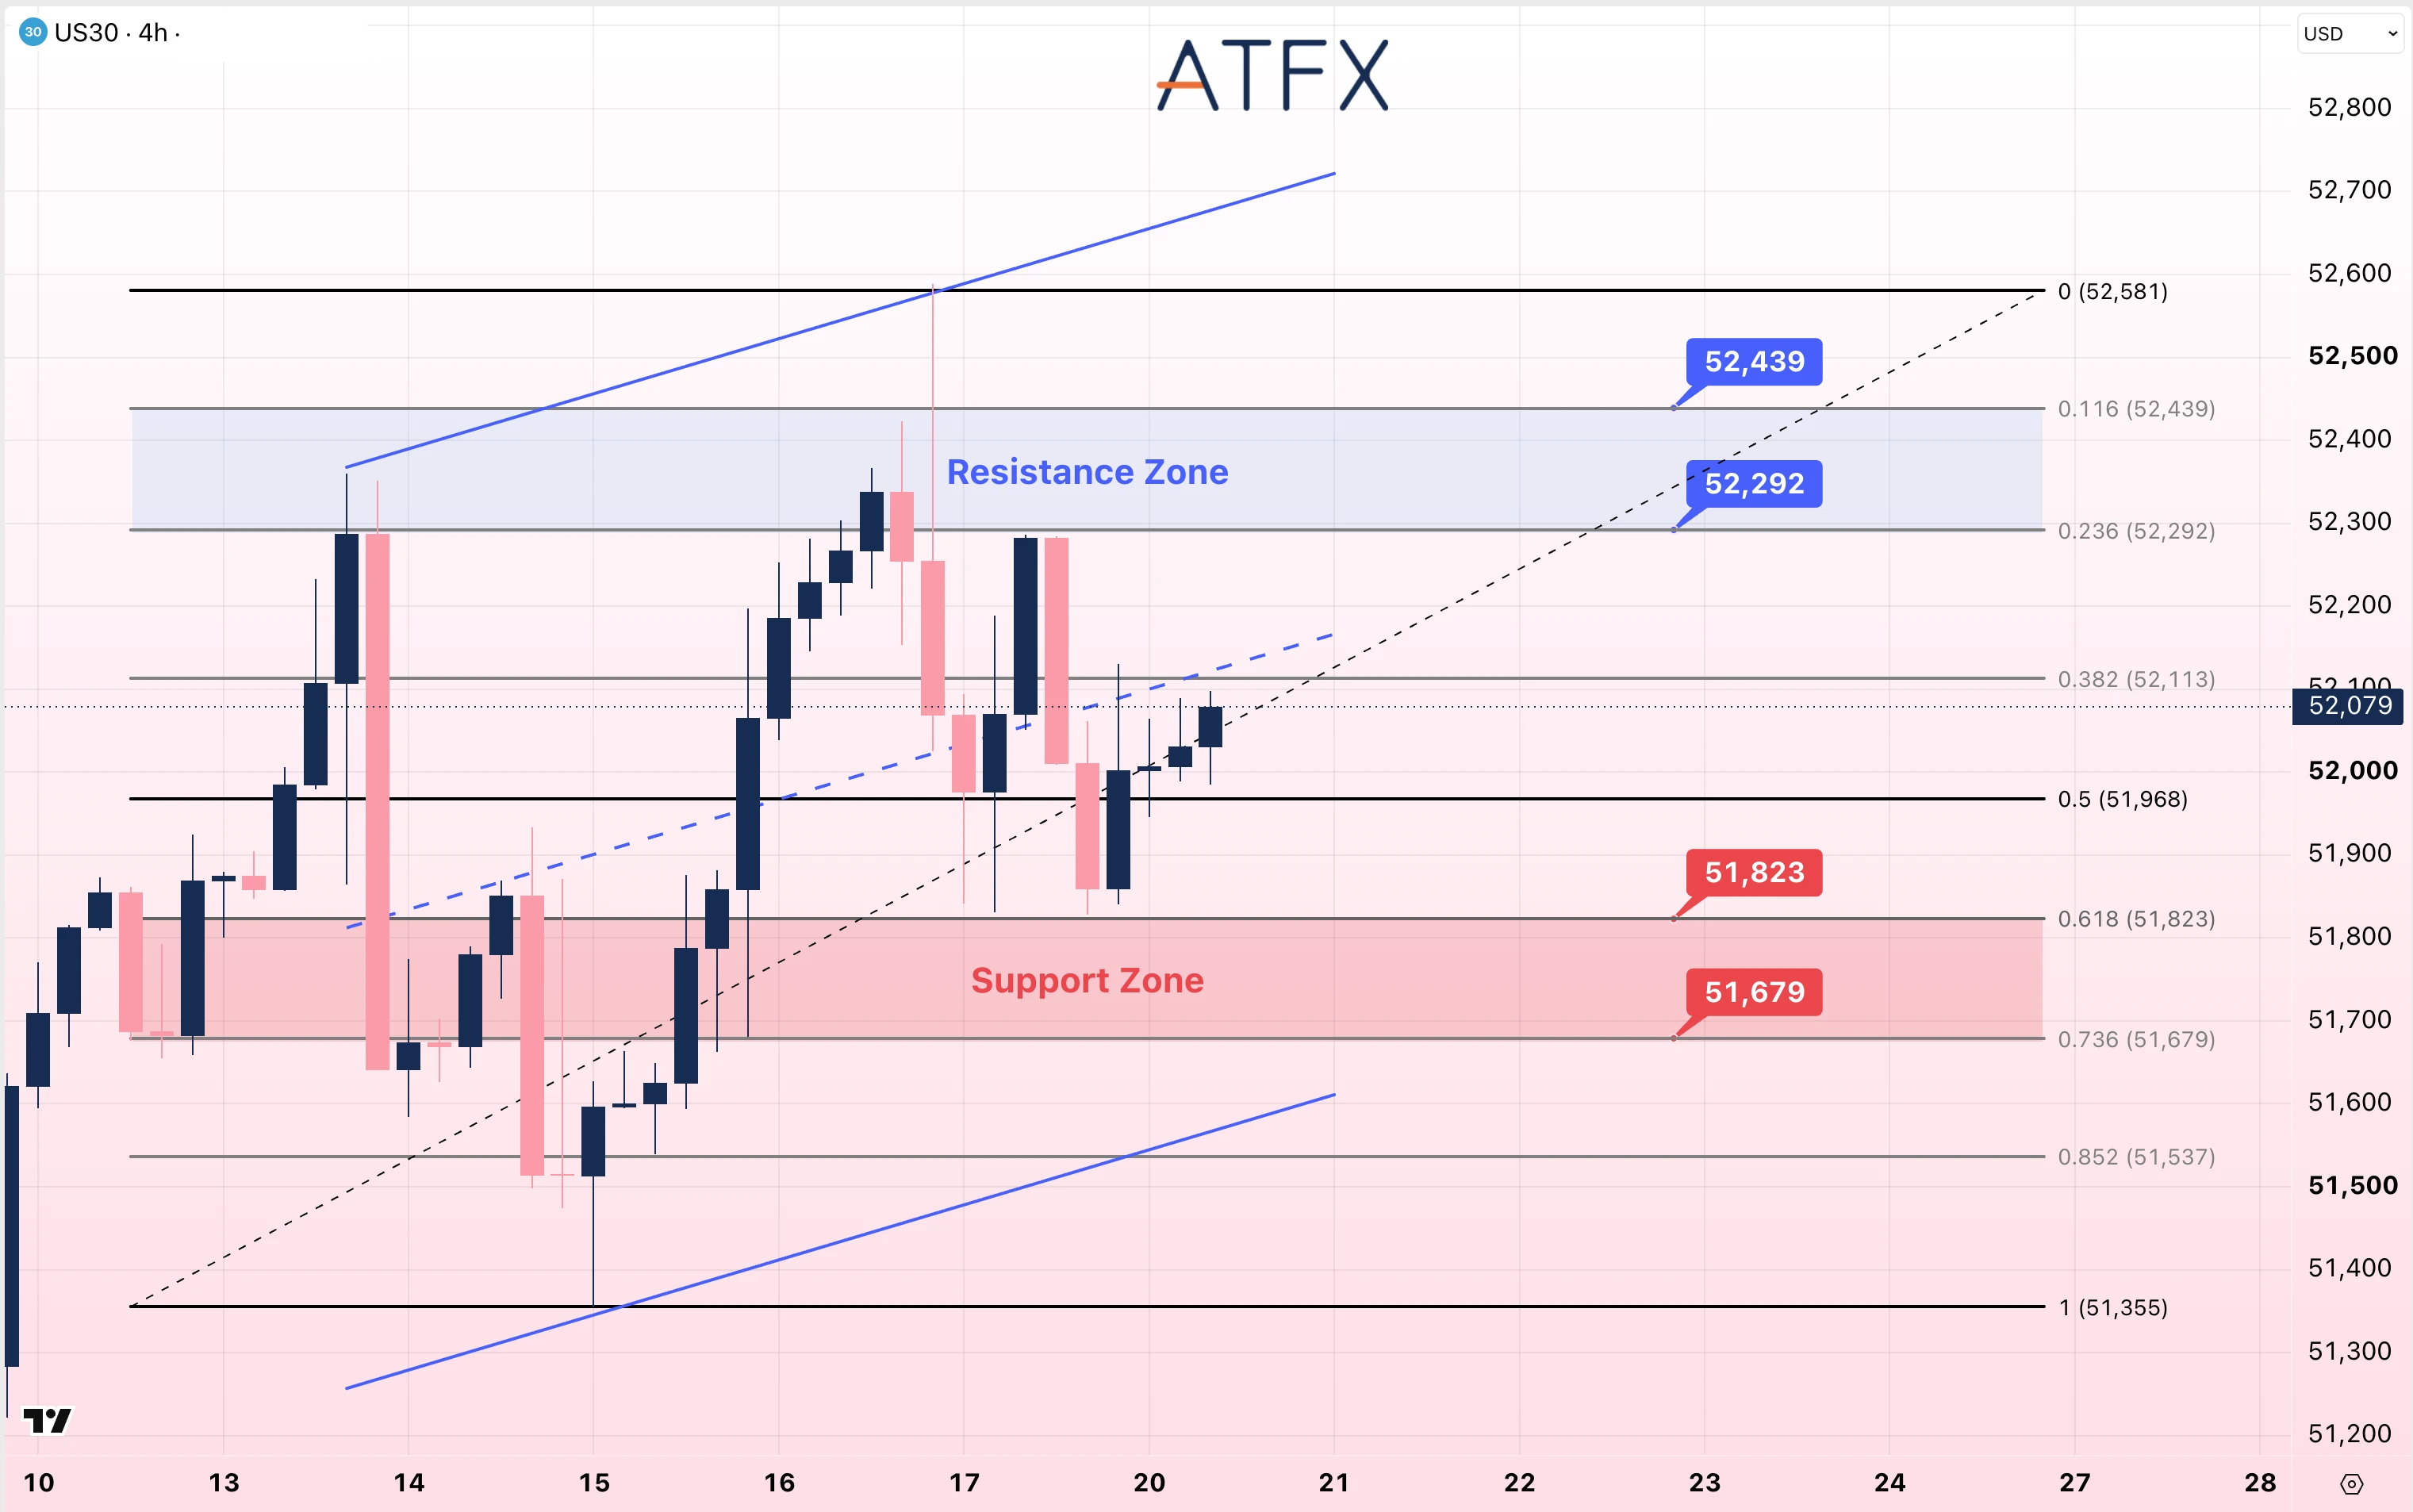
 

Dow Jones Futures chart for 20 October 2026 showing support at 51,943 and resistance at 52,442 with a cautious outlook.

  • Resistance: 52292/52439
  • Support: 51823/51679

Analyst’s View: The Dow lagged Monday’s technology recovery; GM earnings and US housing data are today’s catalysts, while higher yields remain a valuation constraint. US30 is near 52,079, below the rising channel’s midline and 52,113 Fibonacci level. Above 52,292, the next marked resistance is 52,439; below 51,823, the next marked support is 51,679.

Bias: Neutral to Cautiously Bearish
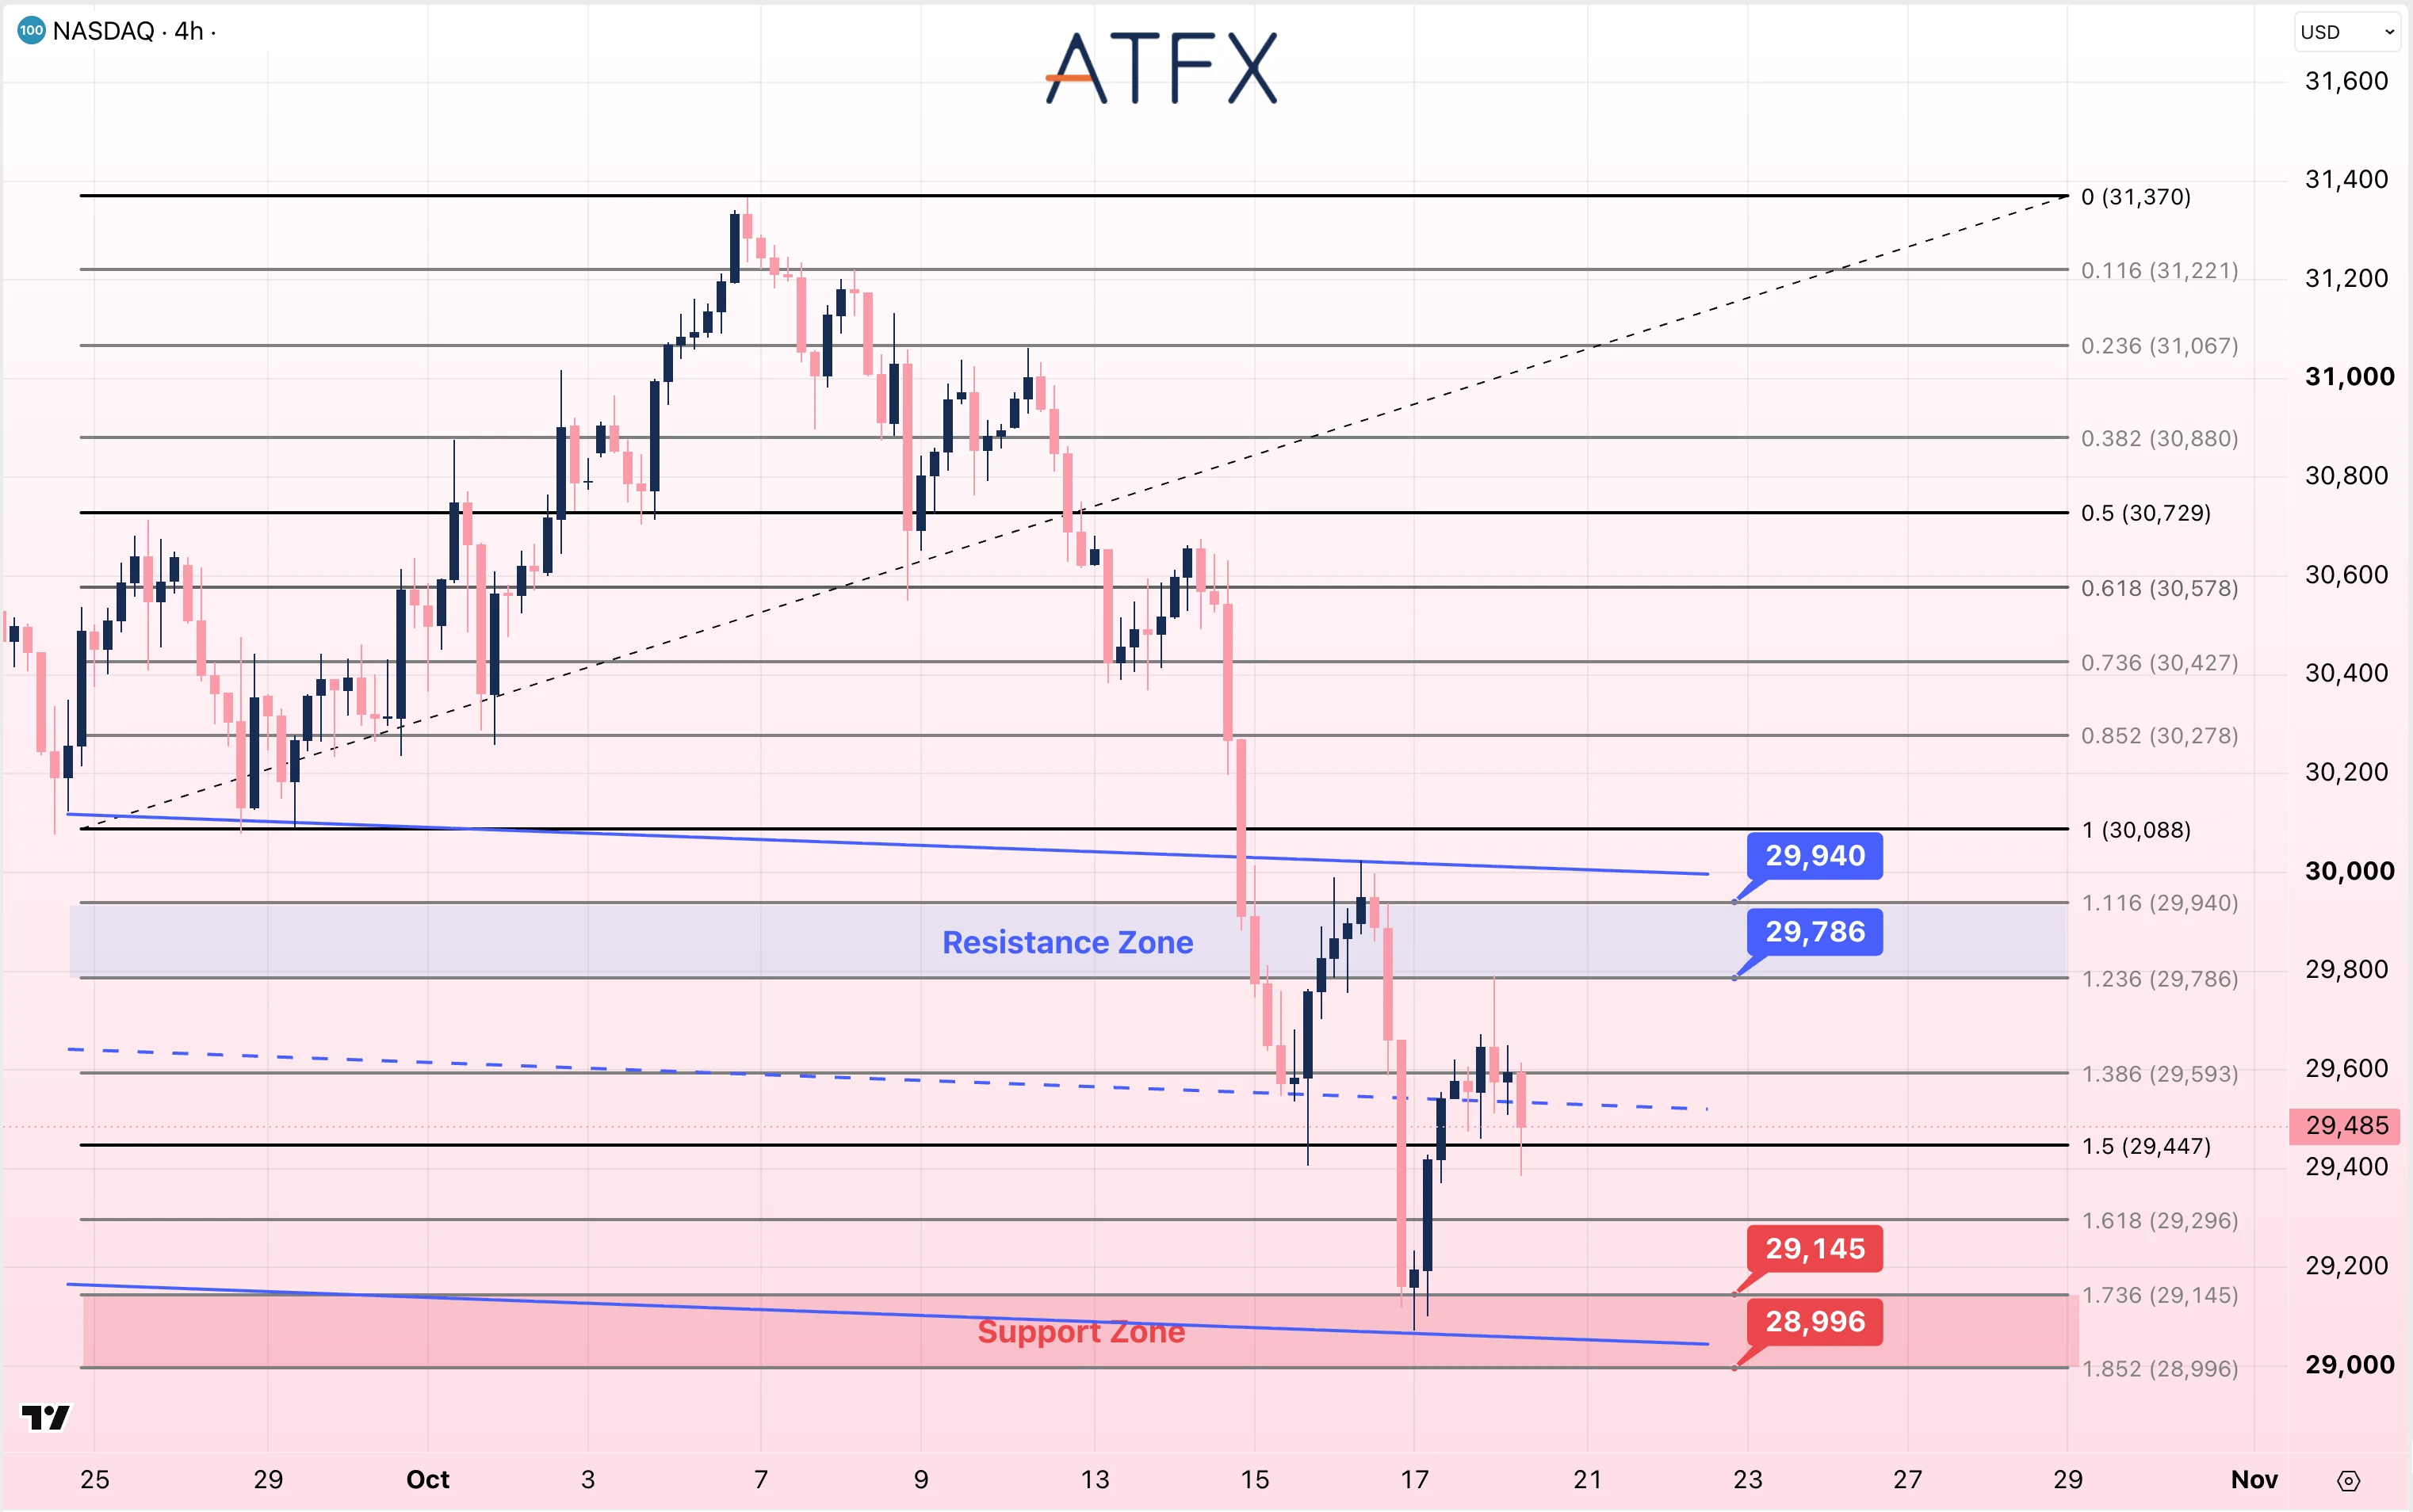
 

NASDAQ 100 chart on 20 October 2026 with a cautiously bearish bias, showing support at 29,637 and resistance at 30,159.

  • Resistance: 29786/29940
  • Support: 29145/28996

Analyst’s View: Monday’s chip-stock recovery provides context for the rebound, but higher yields and upcoming technology earnings remain key tests. NAS100 is near 29,485, below the descending channel’s midline and 29,593 Fibonacci level. A recovery above 29,786 would bring 29,940 into focus; below 29,145, the next marked support is 28,996.

Bias: Cautiously Bearish
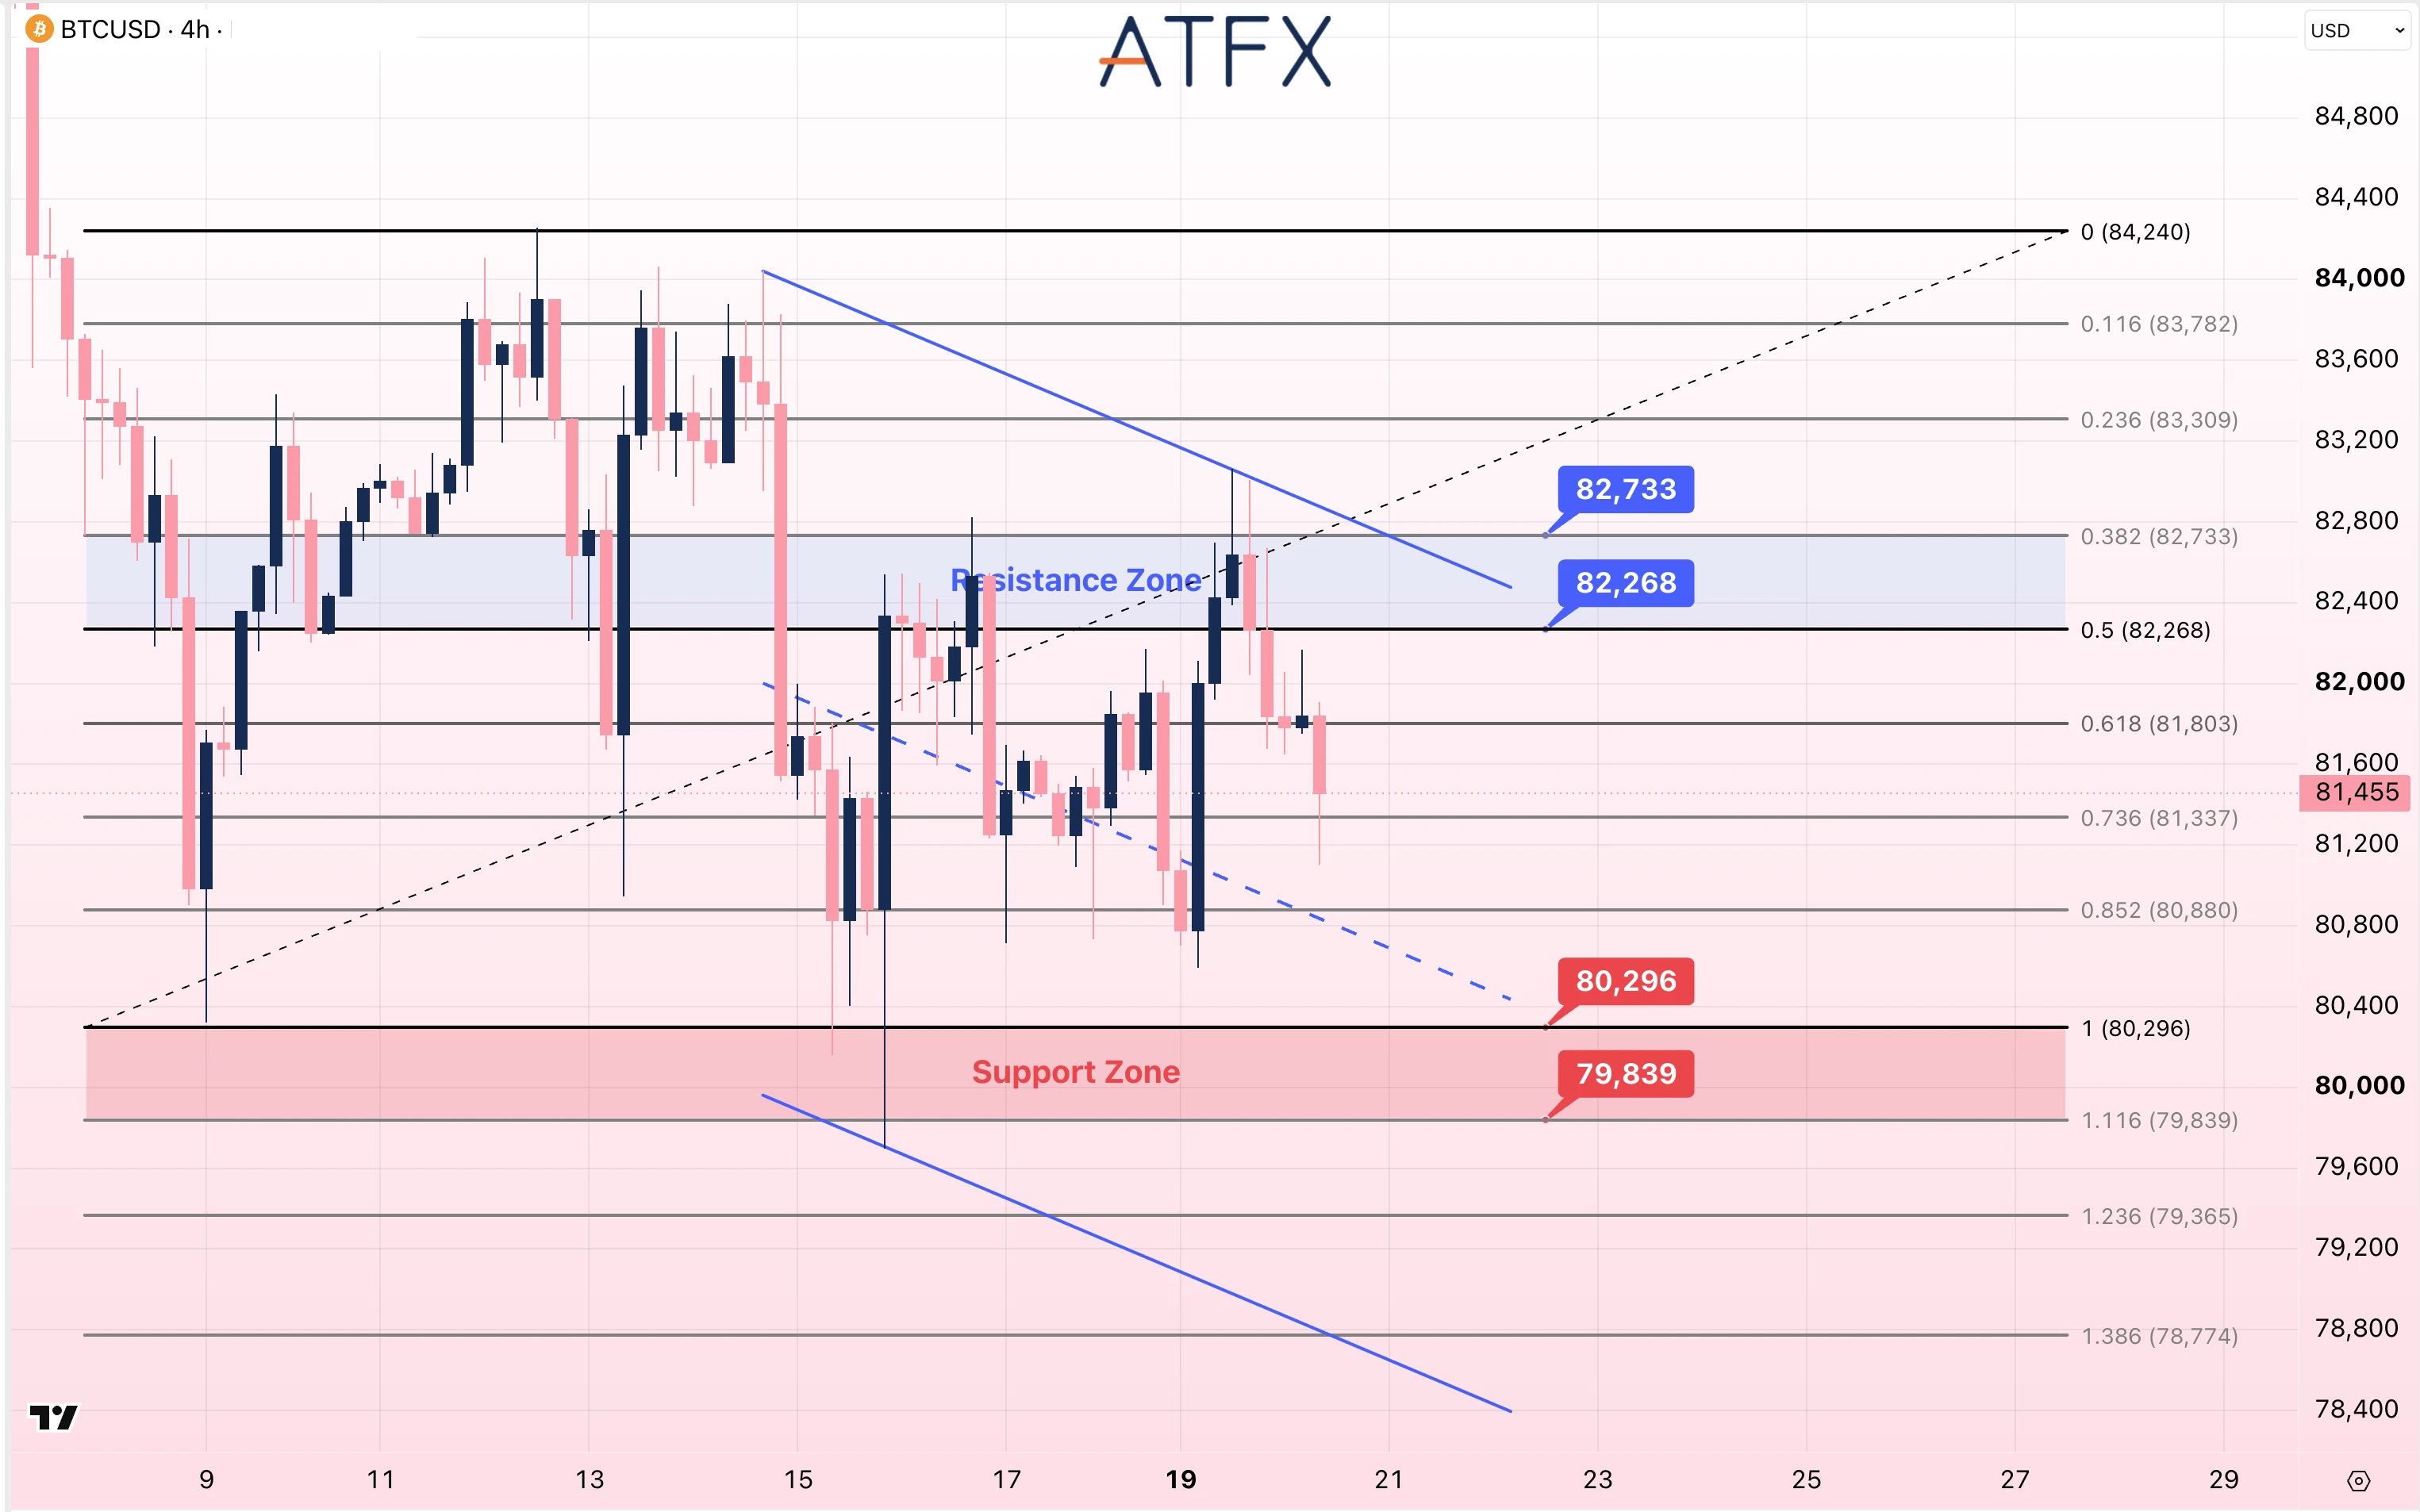
 

Bitcoin (BTC/USD) chart for 20 October 2026 with support at 80,560 and resistance at 83,457, biased cautiously bearish.

  • Resistance: 82268/82733
  • Support: 80296/79839

Analyst’s View: Monday’s technology rebound supported risk appetite, while higher Treasury yields limited Bitcoin’s gains. On the four-hour chart, BTC is near $81,455 after retreating from the $82,733 area, below the $81,803 Fibonacci level within a descending channel. A recovery above $82,268 would bring $82,733 into focus. Below the intermediate levels at $81,337/$80,880, marked support is at $80,296, followed by $79,839.

Bias: Cautiously Bearish

Disclaimer: This analysis is for reference only and does not constitute investment advice.

About the author


Martin Lam is ATFX Chief Analyst for Asia Pacific, with over 20 years of experience in global forex and investment markets. He holds a degree in Finance and Economics from Deakin University and has held senior roles at leading FX brokerage firms.

Recent News
Free Demo Account
✅ Practice risk-free
✅ Master the markets
Trade live when you’re ready!
Popular posts

ATFX

ATFX UK (AT Global Markets (UK) Ltd.) focuses on developing institutional business and professional investors and does not accept retail clients under its UK Financial Conduct Authority (FCA) license.

For professional client applications, please contact [email protected].

ATFX

Important Notice

We would like to inform you that, in order to ensure full compliance with the regulations of the Brazilian Securities and Exchange Commission (CVM), the opening of new accounts for individuals residing or domiciled in the Federative Republic of Brazil is currently unavailable.

This measure is necessary to complete the final stages of the technological and operational integration process with our local intermediary partner, Levycam CCTVM Ltda. (CNPJ 50.579.044/0001-96), in accordance with the guidelines set forth in CVM Guidance Opinion No. 33/2005.

As a result, it is not possible to proceed with your account opening request at this time. Once the regulatory and operational integration process is completed, the account opening flow will be enabled, and interested parties will be duly informed.

ATFX is not authorized by the Brazilian Securities and Exchange Commission (CVM) to offer intermediation or distribution services for securities issued abroad to investors residing in the Federative Republic of Brazil. Currently, ATFX does not operate nor actively offer intermediation services in Brazil. By accessing this website, investors declare that they are aware of the applicable legal restrictions and agree that they are operating outside the jurisdiction of the CVM. Investments abroad are not covered by the protection mechanisms existing in Brazil, such as the MRP and the FGC. With the objective of enabling future regularized operations, ATFX has entered into a contract for the provision of foreign intermediation services with the Brazilian brokerage firm Levycam CCTVM (CNPJ 50.579.044/0001-96), as provided for in CVM Guidance Opinion No. 33/2005. However, activities related to local intermediation are still in the pre-operational phase (technological and regulatory integration process). If you have any questions regarding the regulation of your trading accounts, please contact us.

ATFX

🌍 Welcome to ATFX!

To provide you with the best trading experience in Iraq, please visit our localized website:

There, you’ll find all products, services, and contact information tailored specifically for you. Thank you for choosing ATFX!

ATFX

Restrictions on Use

Products and Services on this website https://www.atfx.com/en-ae/ are not suitable
in your country. Such information and materials should not be regarded as or
constitute a distribution, an offer, or a solicitation to buy or sell any investments.
Please visit https://www.atfx.com/en/ to proceed.

ATFX

使用限制

本网站的产品及服务不适合英国居民。网站内部的信息和素材不应被视为分销,要约,买入或卖出任何投资产品。请继续访问 https://www.atfx.com/en/ 。

ATFX

Restrictions on Use

Products and Services on this website are not suitable for the UK residents. Such information and materials should not be regarded as or constitute a distribution, an offer, or a solicitation to buy or sell any investments. Please visit https://www.atfx.com/en/ to proceed.

ATFX

Restrictions on Use

Please note, you may be accessing this page from outside Australia. Products and Services on https://www.atfx.com/en-au/ may not be suitable in your country. The information provided should not be considered as an offer, solicitation, or distribution for any investments.

Restrictions on Use

Products and Services on https://www.atfx.com/en-au/ are not suitable in your country. The information provided should not be considered as an offer, solicitation, or distribution for any investments.

Choose another region to see content specific to your location.

ATFX

Restrictions on Use

ATFX

Restrictions on Use

AT Global Markets (UK) Limited does not offer trading services to retail clients.
If you are a professional client, please visit https://www.atfxconnect.com/