Market Highlight 25/02/2026
The United States began imposing a new 10% temporary global import tariff on Tuesday, with the Trump administration working to raise the rate to 15%. U.S. consumer confidence rebounded more than expected in February, helping Wall Street post gains. The Dow Jones rose 0.76%, the S&P 500 climbed 0.77%, and the Nasdaq advanced 1.04%. The U.S. Dollar Index edged up 0.14% to 97.82, while EUR/USD slipped 0.11% to 1.1771.
Gold retreated from a three-week high on Tuesday, pressured by a firmer dollar, as markets await greater clarity on the U.S. tariff plan and the outcome of negotiations between Washington and Tehran. Crude oil prices declined after Iran said it was prepared to take all necessary measures to reach an agreement with the U.S. ahead of nuclear talks later this week.
Key Outlook 25/02/2026
During the Asian session, markets will watch whether President Trump addresses the latest tariff measures in his State of the Union speech. On the data front, attention will focus on Eurozone releases. Germany’s final Q4 GDP annual reading is expected to remain modest at 0.6%, while Eurozone January CPI is projected to hold at 1.7%. If in line with expectations, these figures are unlikely to alter market views that the ECB will keep rates unchanged this year. Later, Nvidia’s earnings report will be closely watched, as it could provide important guidance for technology stocks and broader U.S. equity sentiment.
Key Data and Events Today:
- 10:00 U.S. President Donald Trump delivers the State of the Union Address ***
- 15:00 EU GERMANY GDP QoQ Final Q4 ***
- 15:00 EU GERMANY GfK Consumer Confidence MAR **
- 18:00 EU CPI YoY Final JAN **
- 23:30 EIA Crude Oil Stock Change **
Tomorrow:
- 05:00 NVIDIA Earnings Release ***
- 16:00 Speech by ECB President Christine Lagarde ***
- 18:00 EU Economic Sentiment FEB **
- 21:30 US Initial Jobless Claims ***
Markets Analysis 25/02/2026
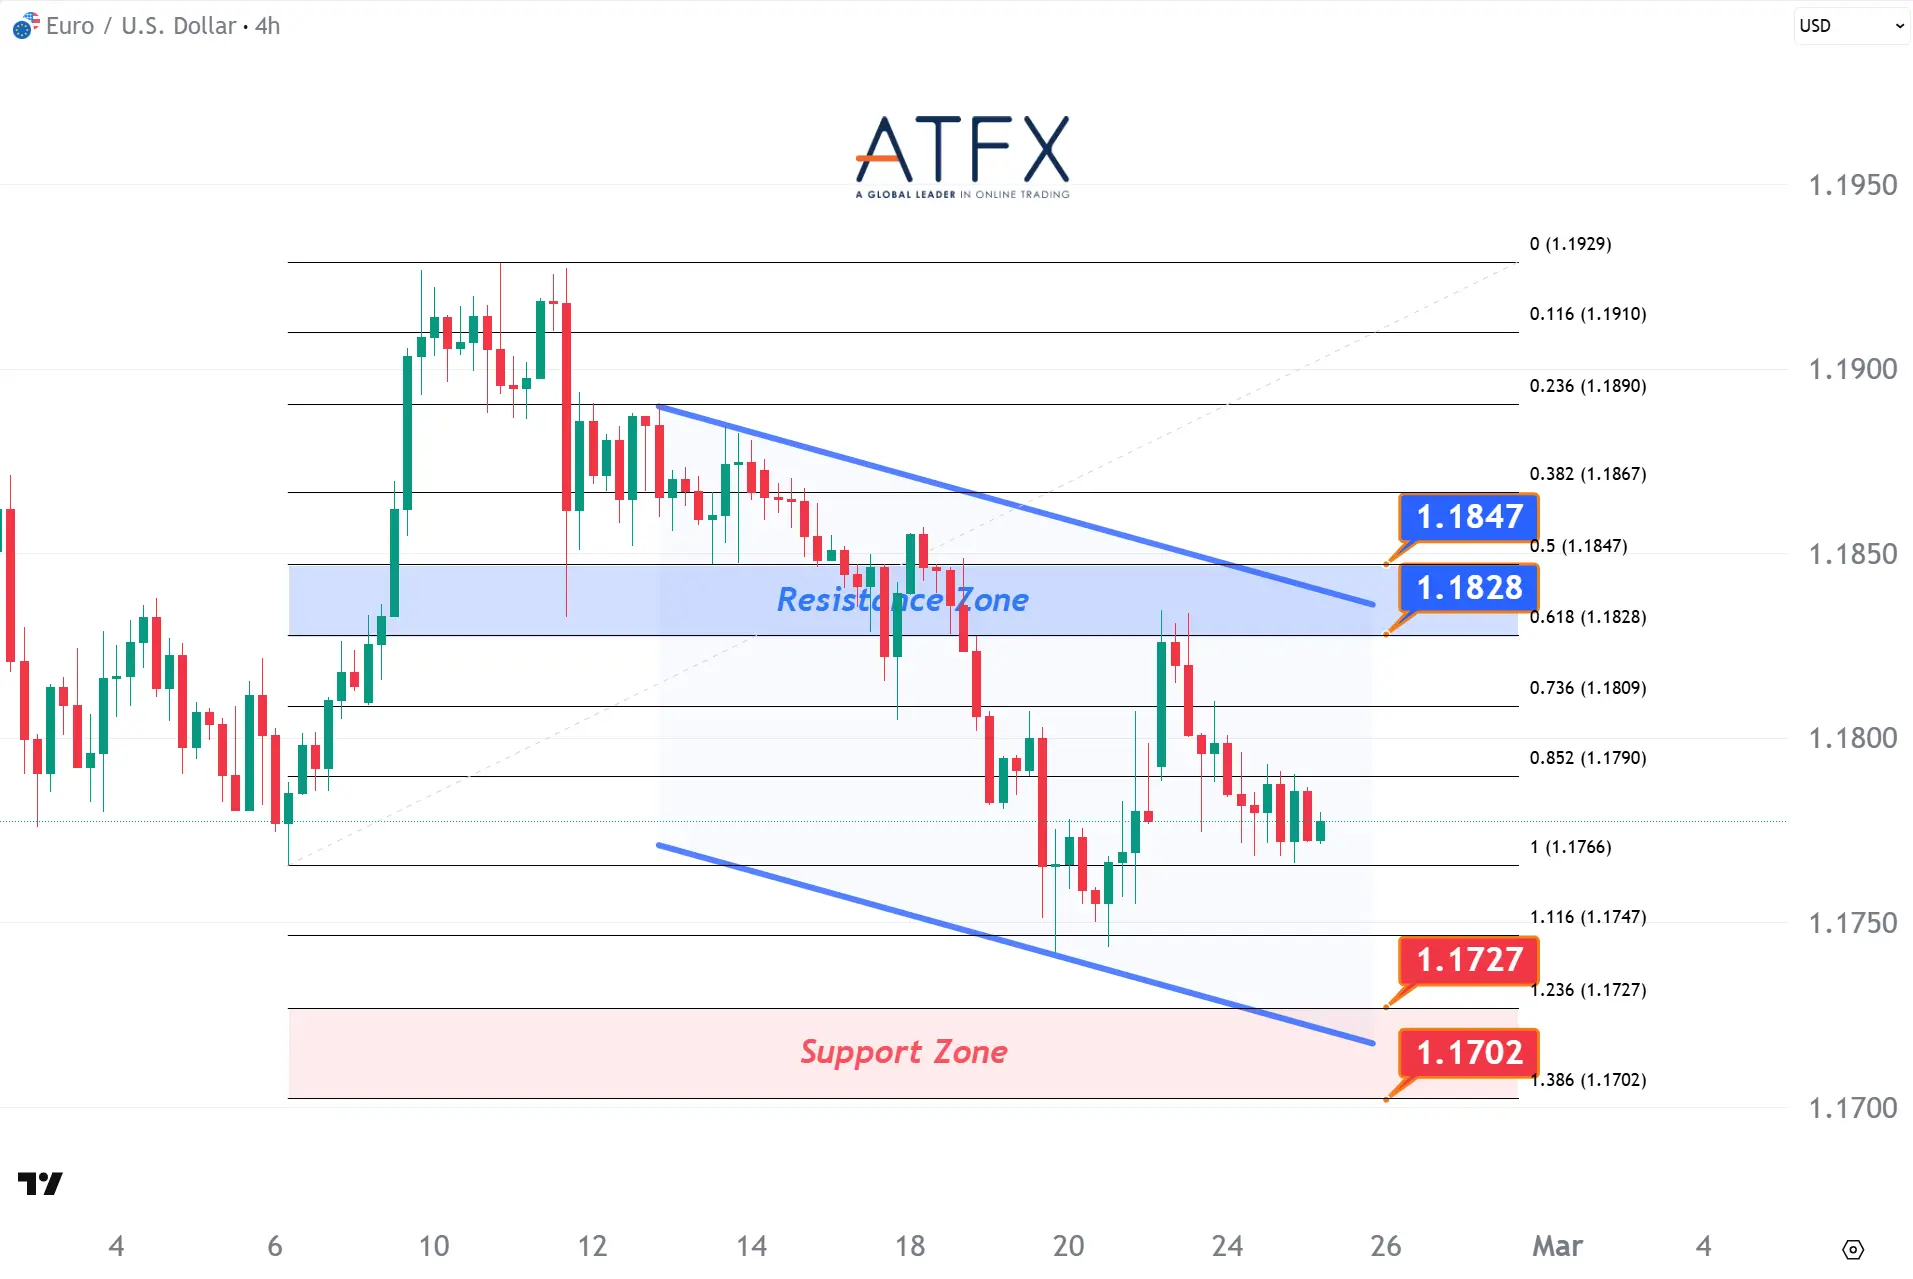
- Resistance: 1.1828 / 1.1847
- Support: 1.1727/1.1702
EUR/USD remains capped below the 1.1828–1.1847 resistance band and the descending trendline, as hawkish Fed signals suppress rate-cut expectations. Although options flows hint at underlying euro demand, failure to break 1.1850 leaves 1.1727–1.1702 support exposed.
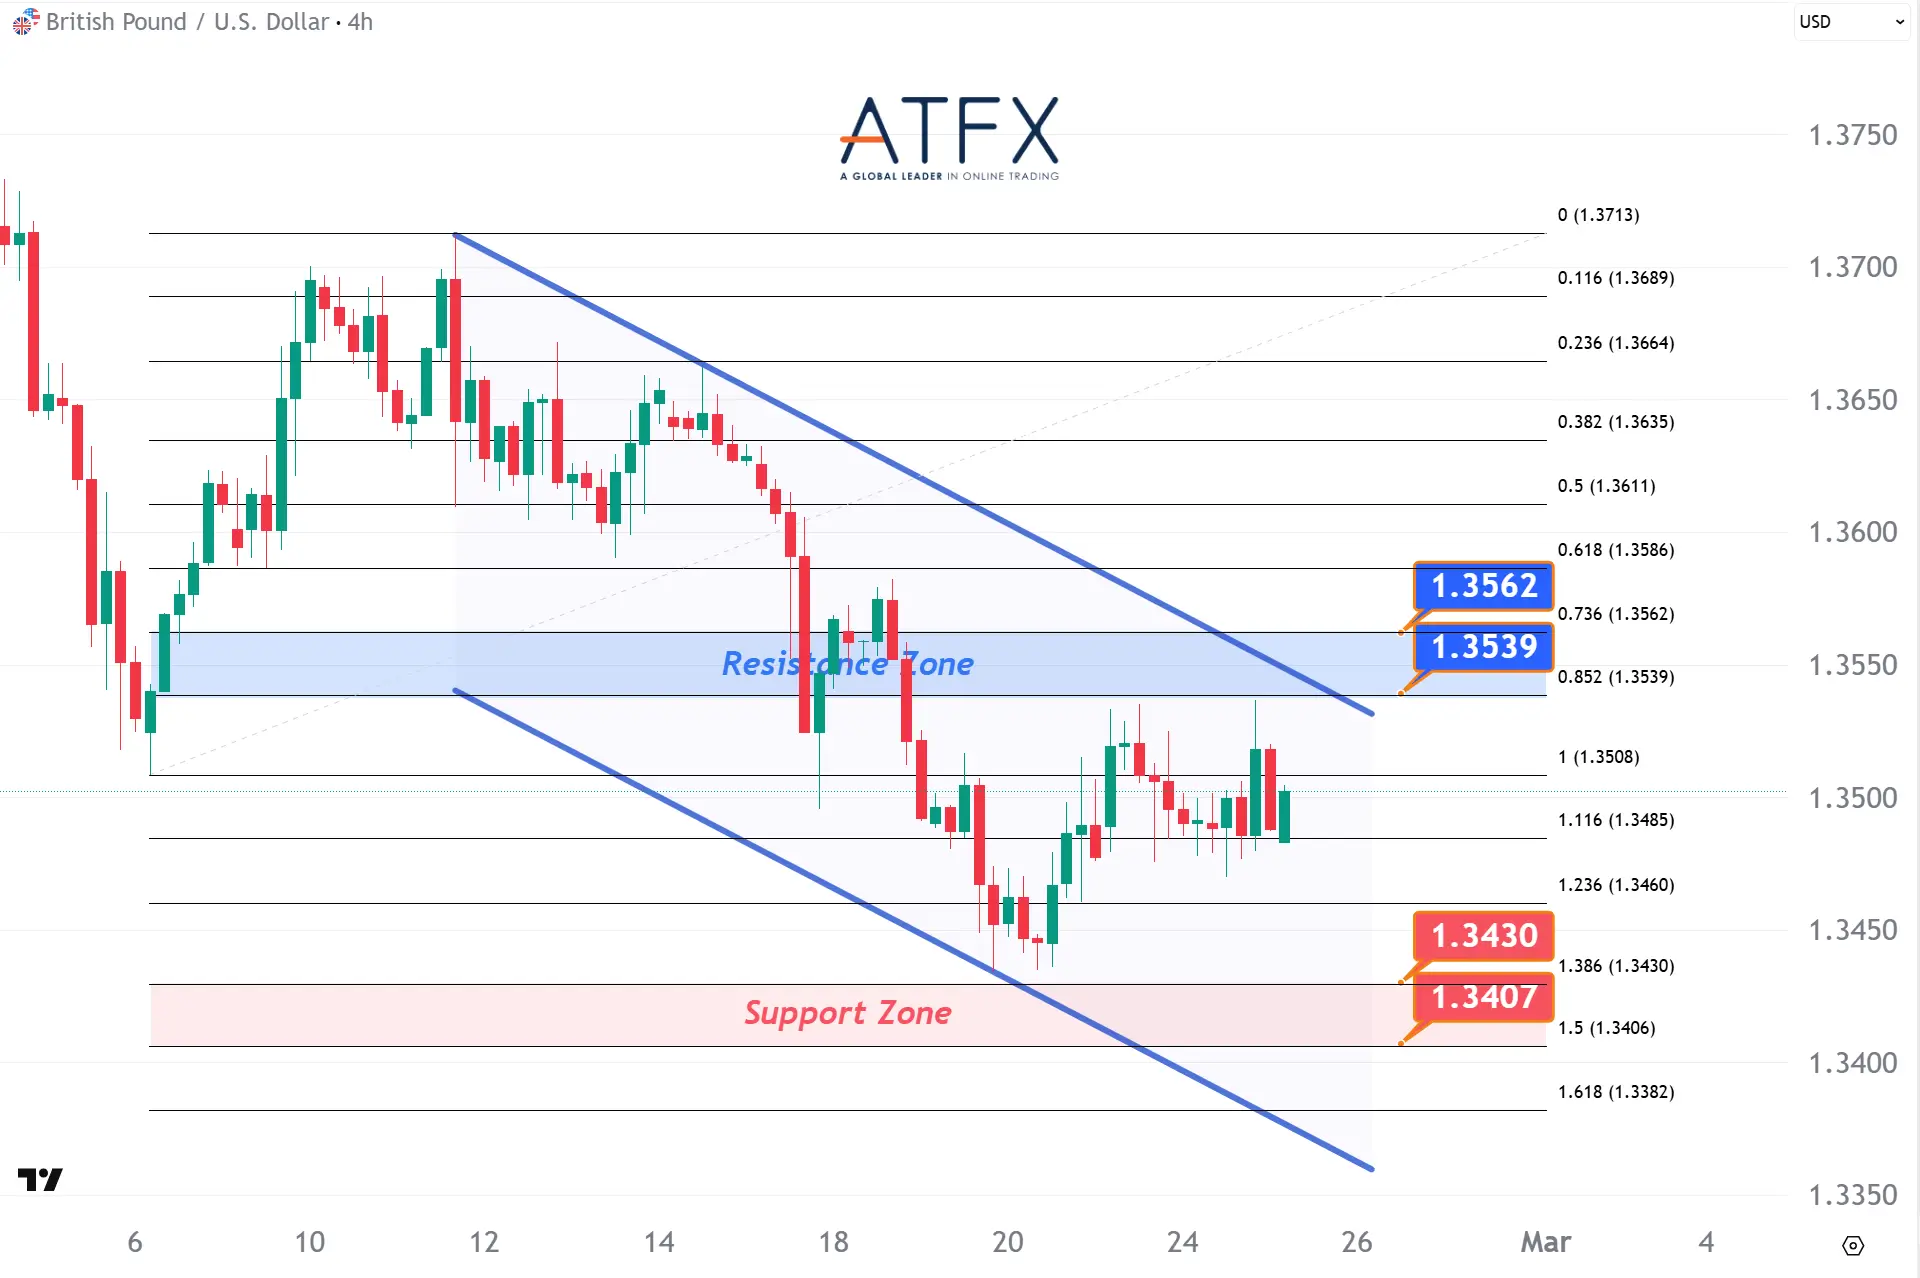
- Resistance: 1.3539/1.3562
- Support: 1.3430/1.3407
GBPUSD remains capped below the 1.3539–1.3562 supply zone and a falling trendline, as hawkish Fed rhetoric pushes back rate-cut bets, supporting the USD. Trade-policy uncertainty adds a risk premium. A break above 1.3562 is needed to ease pressure; otherwise, 1.3430–1.3400 is the first downside magnet.
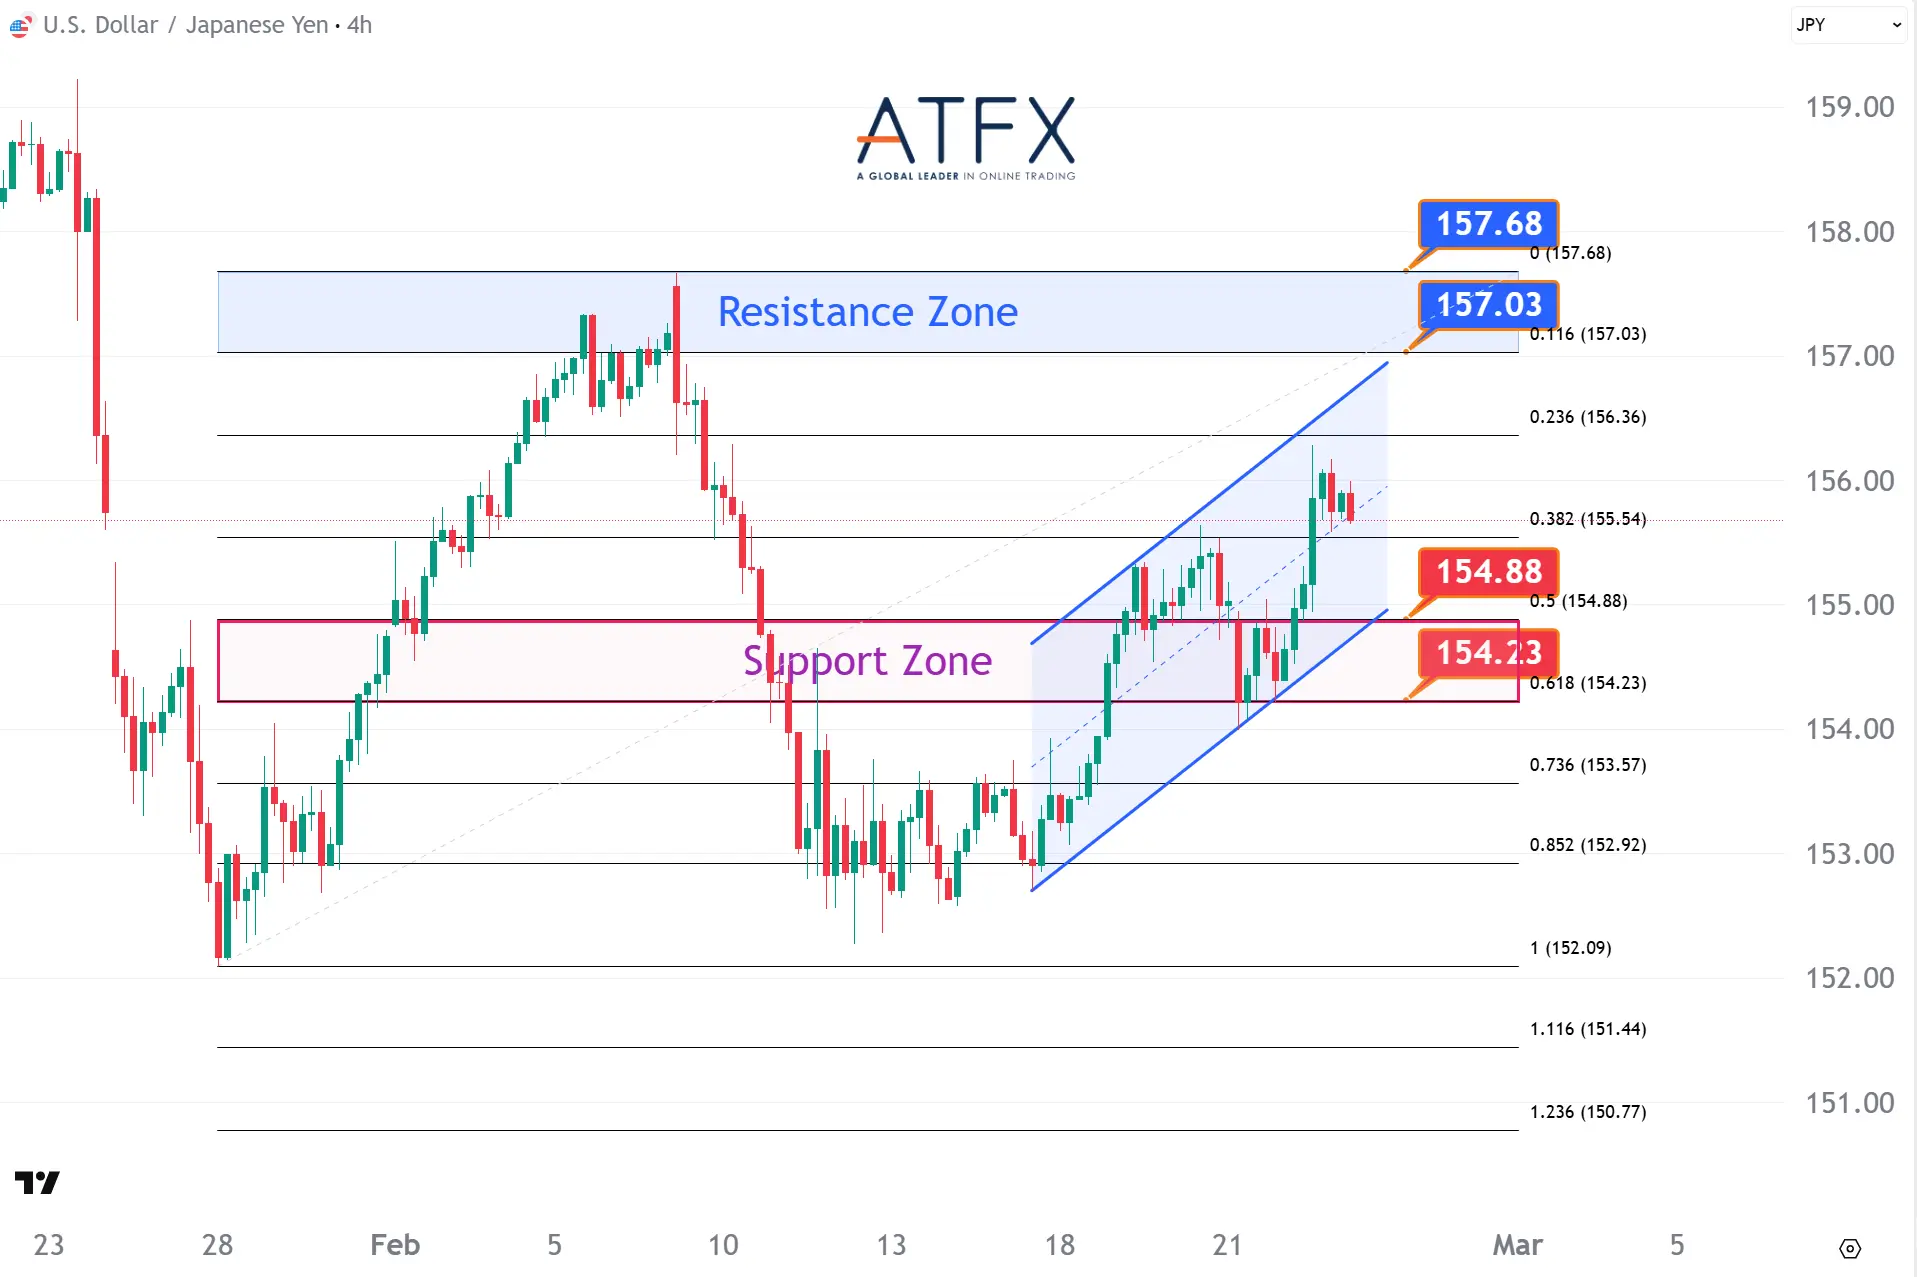
- Resistance: 157.03/157.68
- Support: 154.88/154.23
USD/JPY pushes higher within a rising channel, supported by Fed hawkishness and political hesitation in Japan over further BoJ hikes. Price now approaches the 157.03–157.68 resistance zone; failure to clear this zone could trigger a pullback towards 154.88–154.23 support.
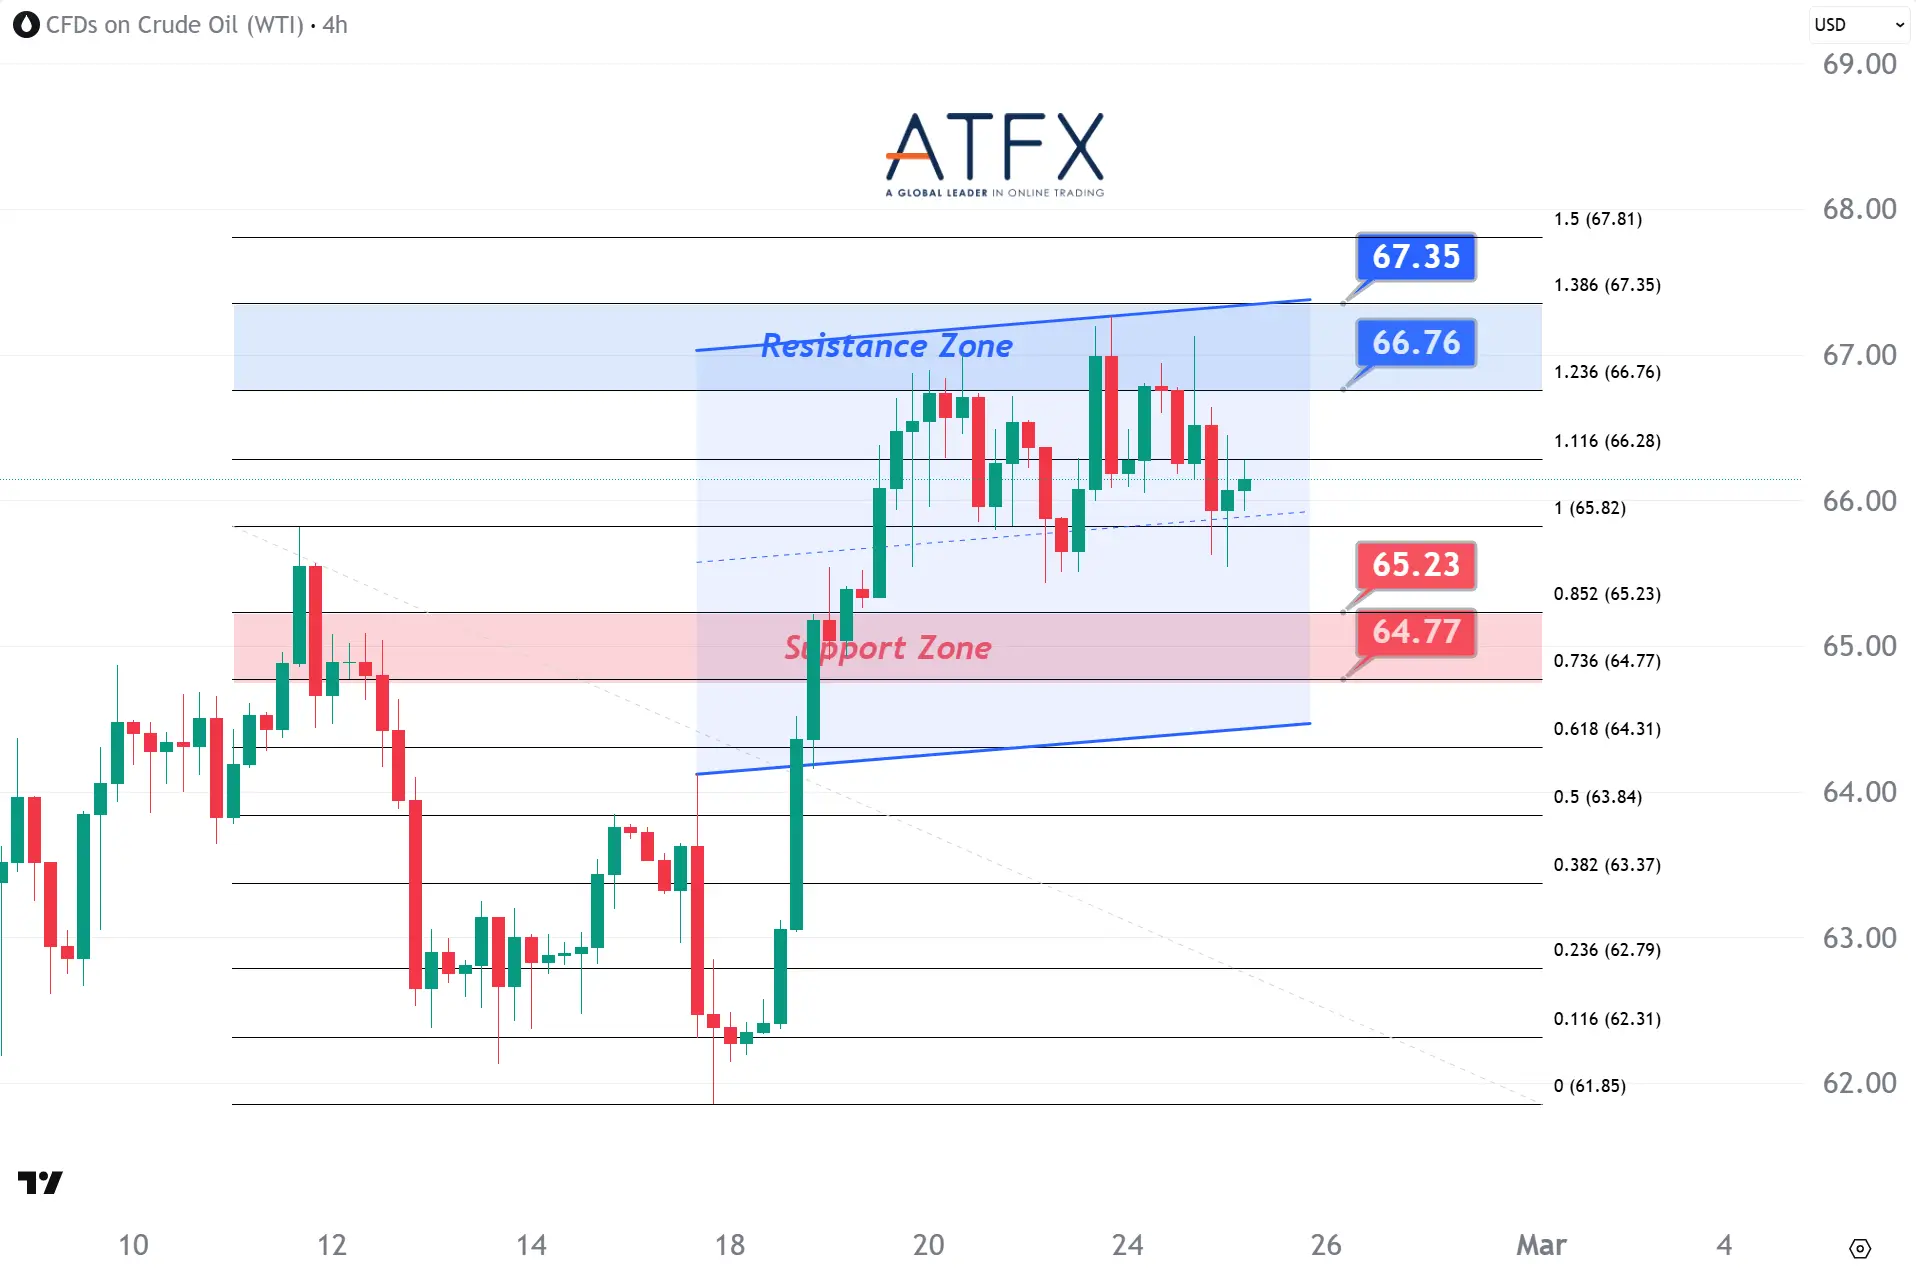
- Resistance: 66.76/67.35
- Support: 65.23/64.77
WTI trades around $66, with Iran’s diplomatic tone capping the geopolitical risk premium. Price remains below the $66.76–67.35 resistance zone, while $64.77–65.23 provides near-term support. A breakout above $67 is needed to revive bullish momentum.
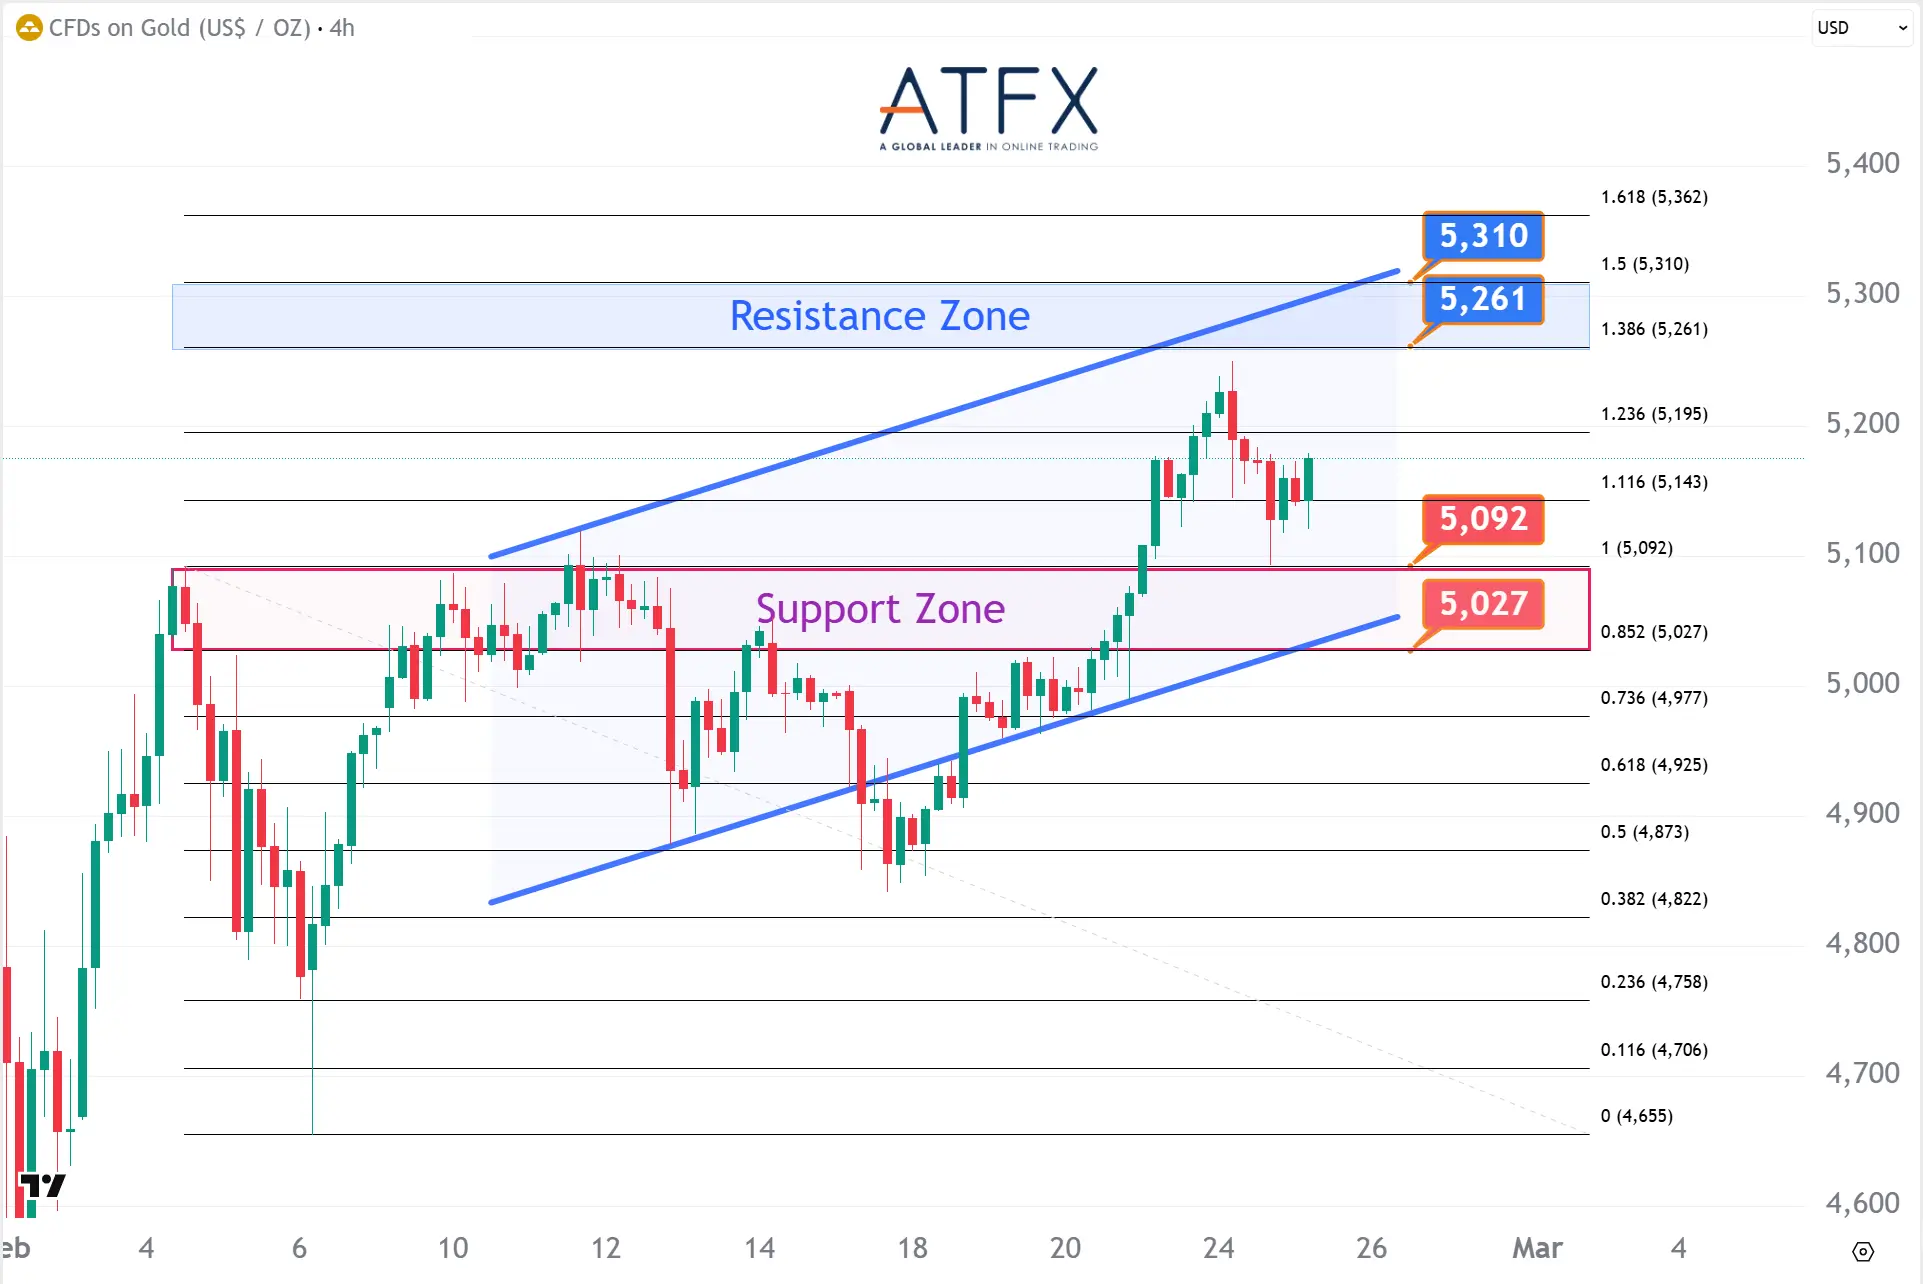
- Resistance: 5261/5310
- Support: 5092/5027
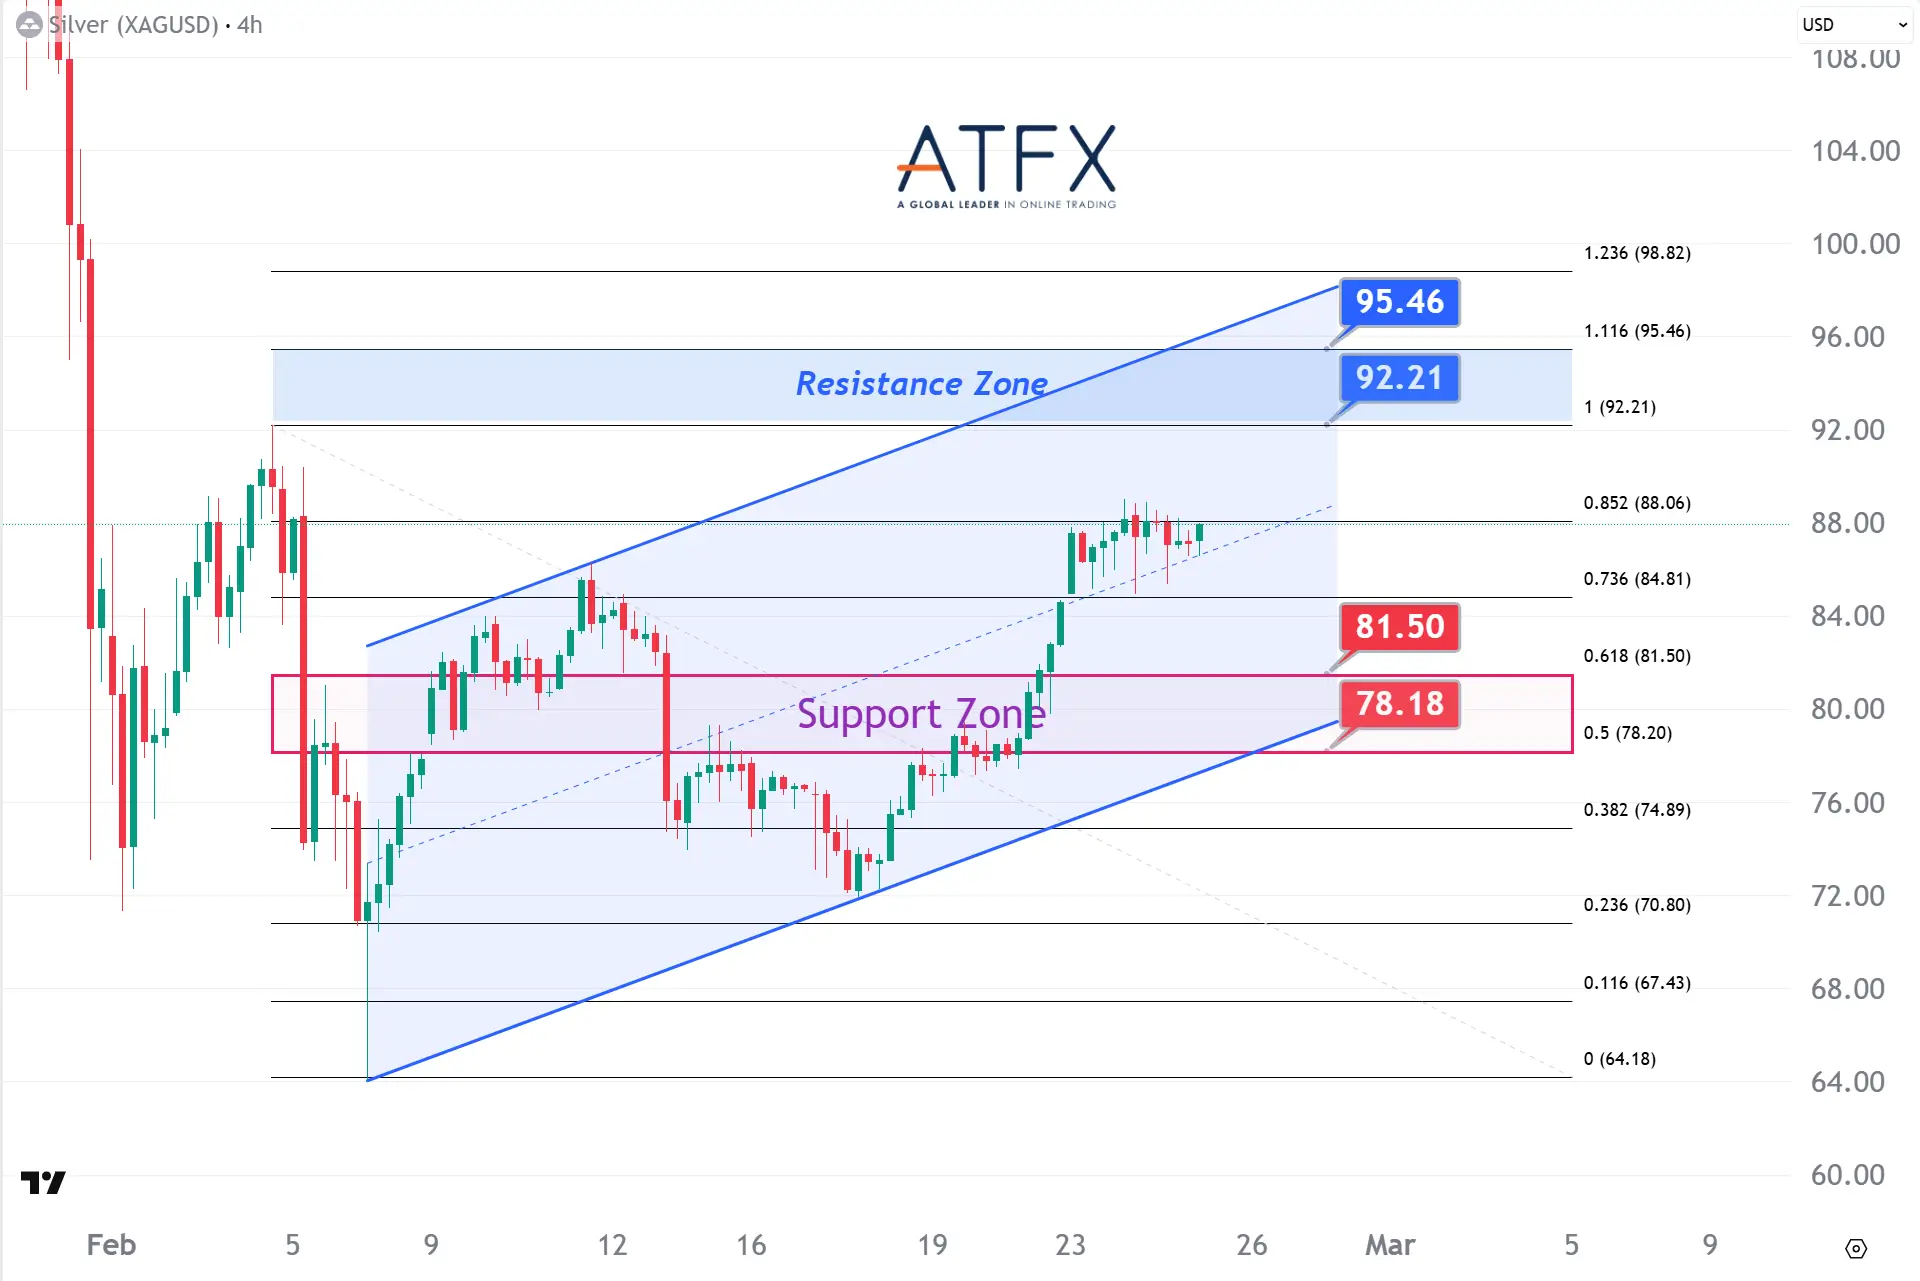
- Resistance: 92.21/95.46
- Support: 81.50/78.18
Gold pulls back towards the $5,092–5,027 support zone after failing to sustain gains near $5,250, as hawkish Fed rhetoric tempers rate-cut expectations. Price remains within an ascending channel, but a break below $5,092 would expose deeper downside risk, while $5,261–5,310 caps the upside.
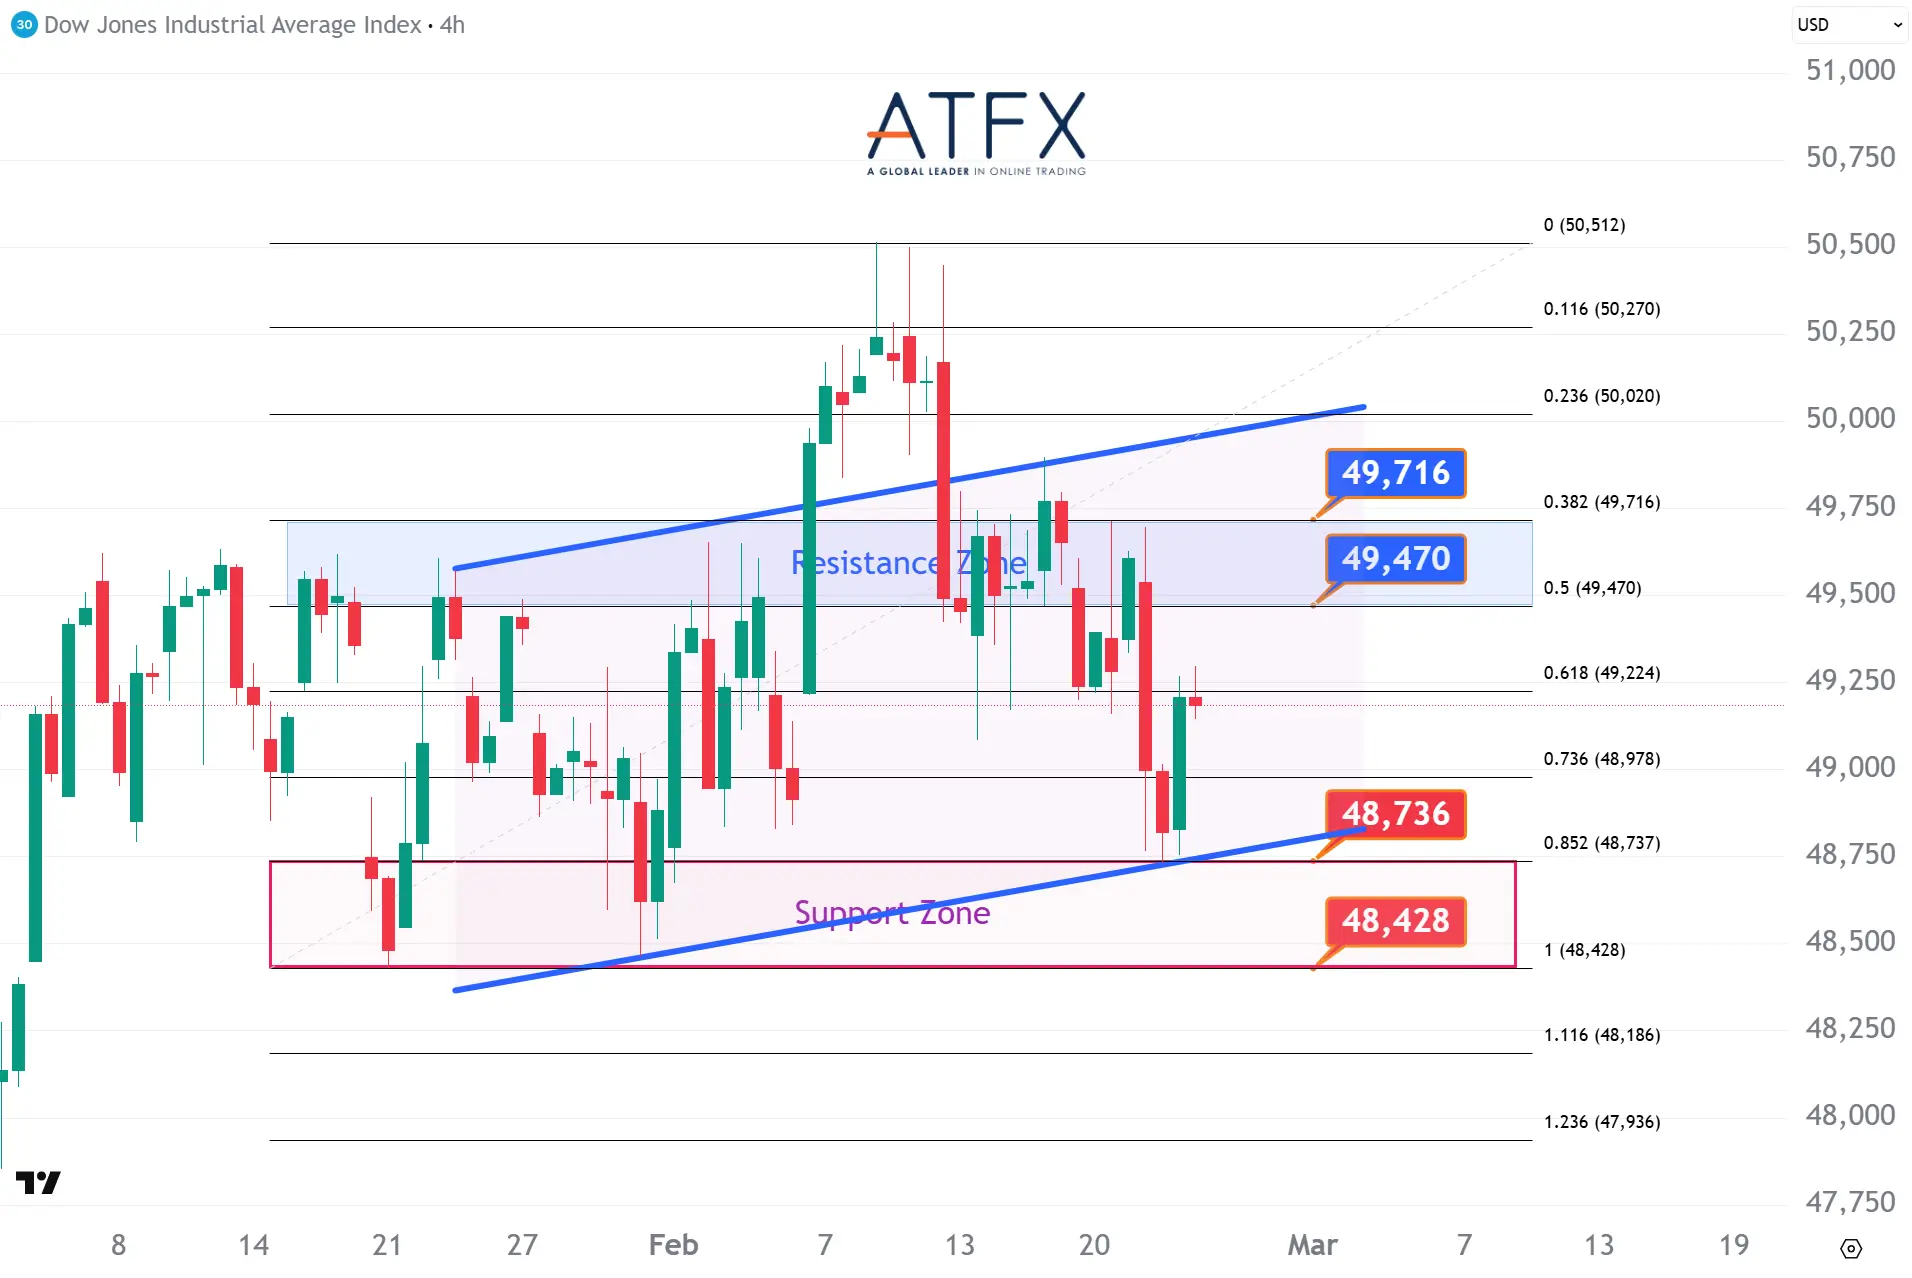
- Resistance: 49470/49716
- Support: 48736/48428
The Dow rebounded 0.76%, but price remains capped below the 49,470–49,716 resistance zone following a relief bounce from AI-driven selloff fears. While earnings optimism supports sentiment, tariff escalation clouds the outlook; a sustained move above 49,716 is needed to regain upside momentum.
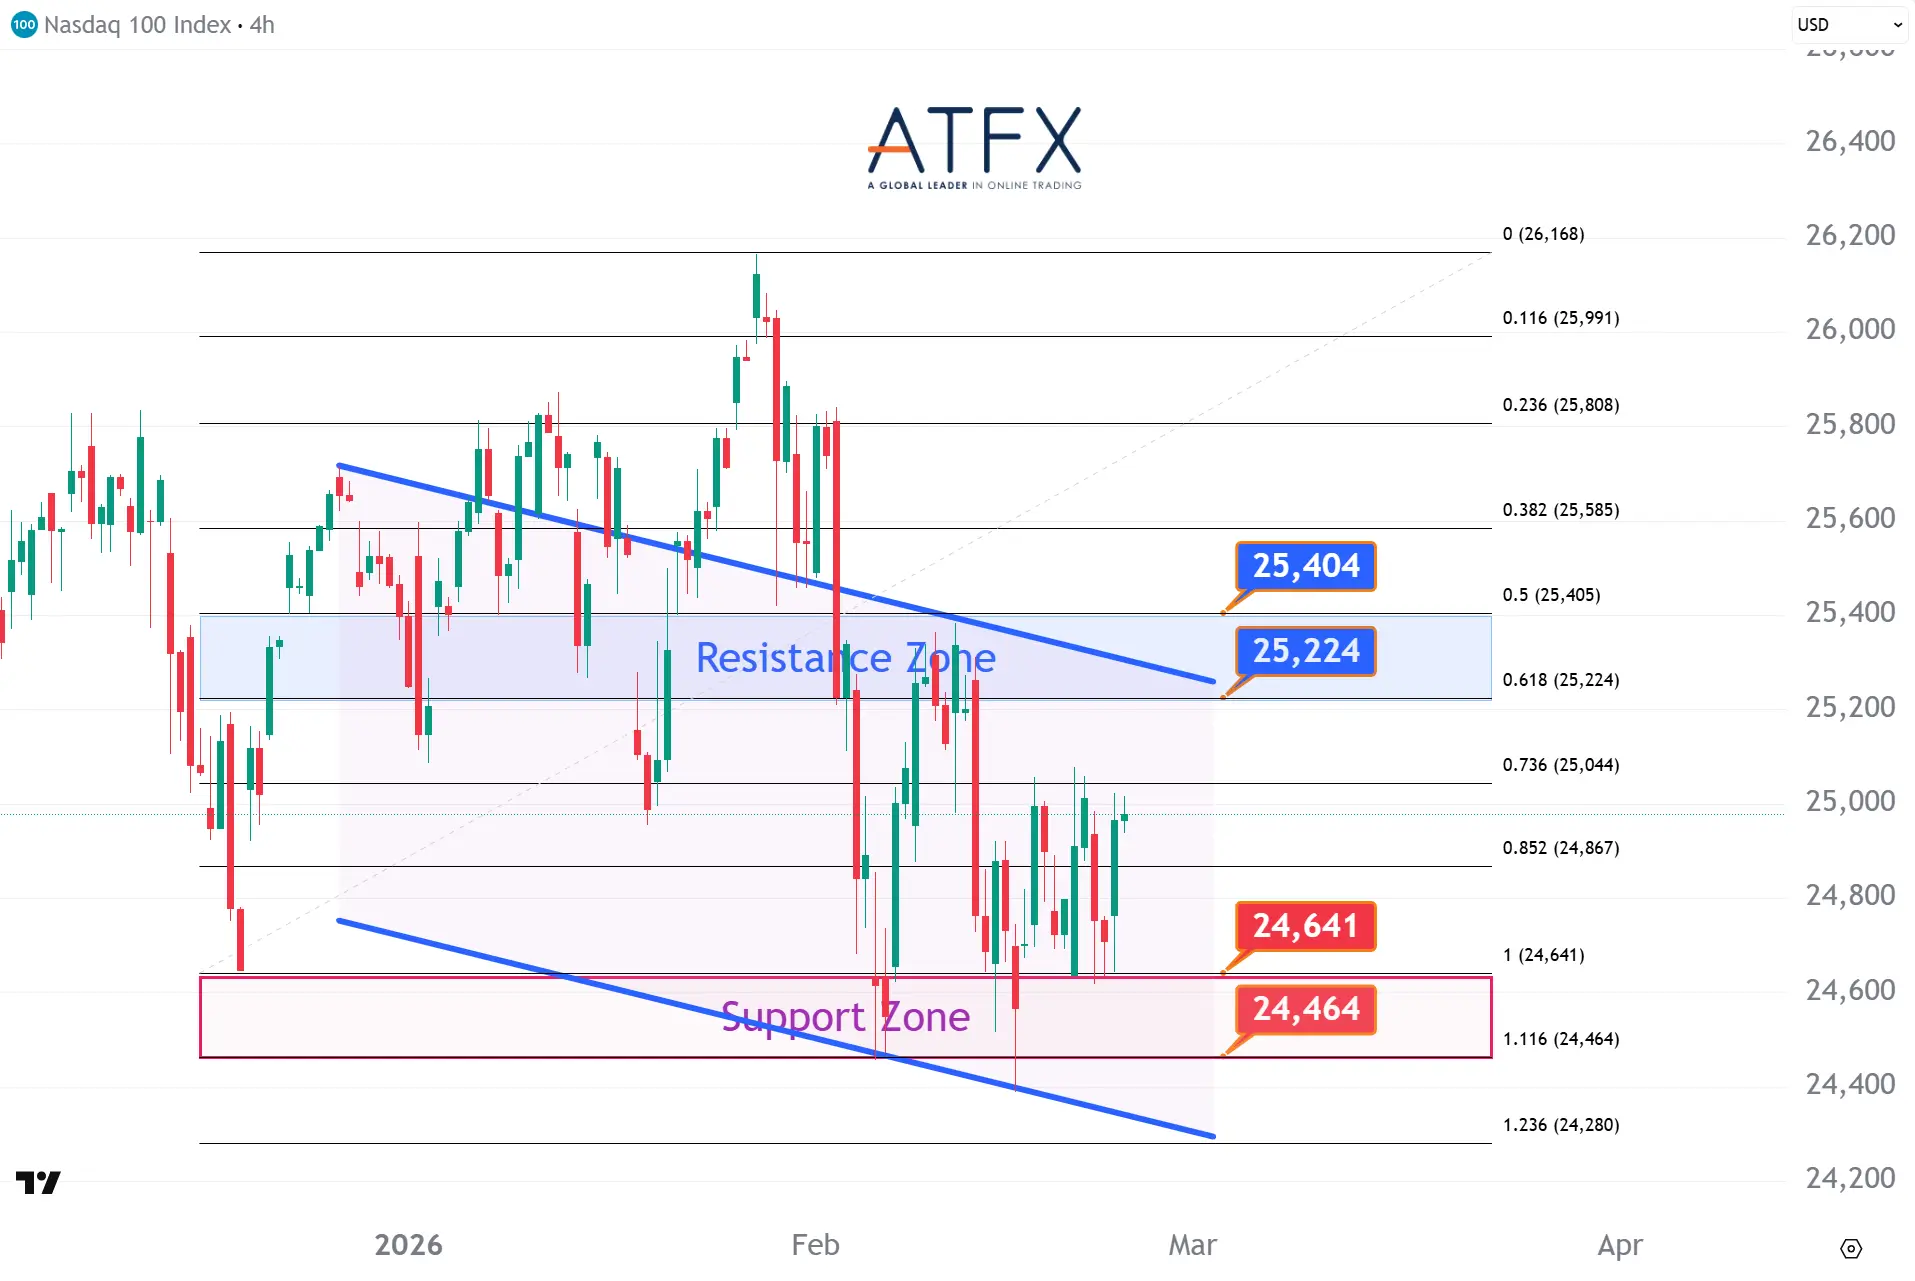
- Resistance: 25224/25404
- Support: 24641/24464
The NAS100 rebounded 1.1% as AMD’s $100 billion AI deal with Meta revived tech optimism. Technically, the index is testing the resistance zone between 25,224 and 25,404, which aligns with the 0.5–0.618 Fibonacci levels. A decisive break above this ceiling is required to shift the current downtrend towards a recovery of the 26,168 peak.
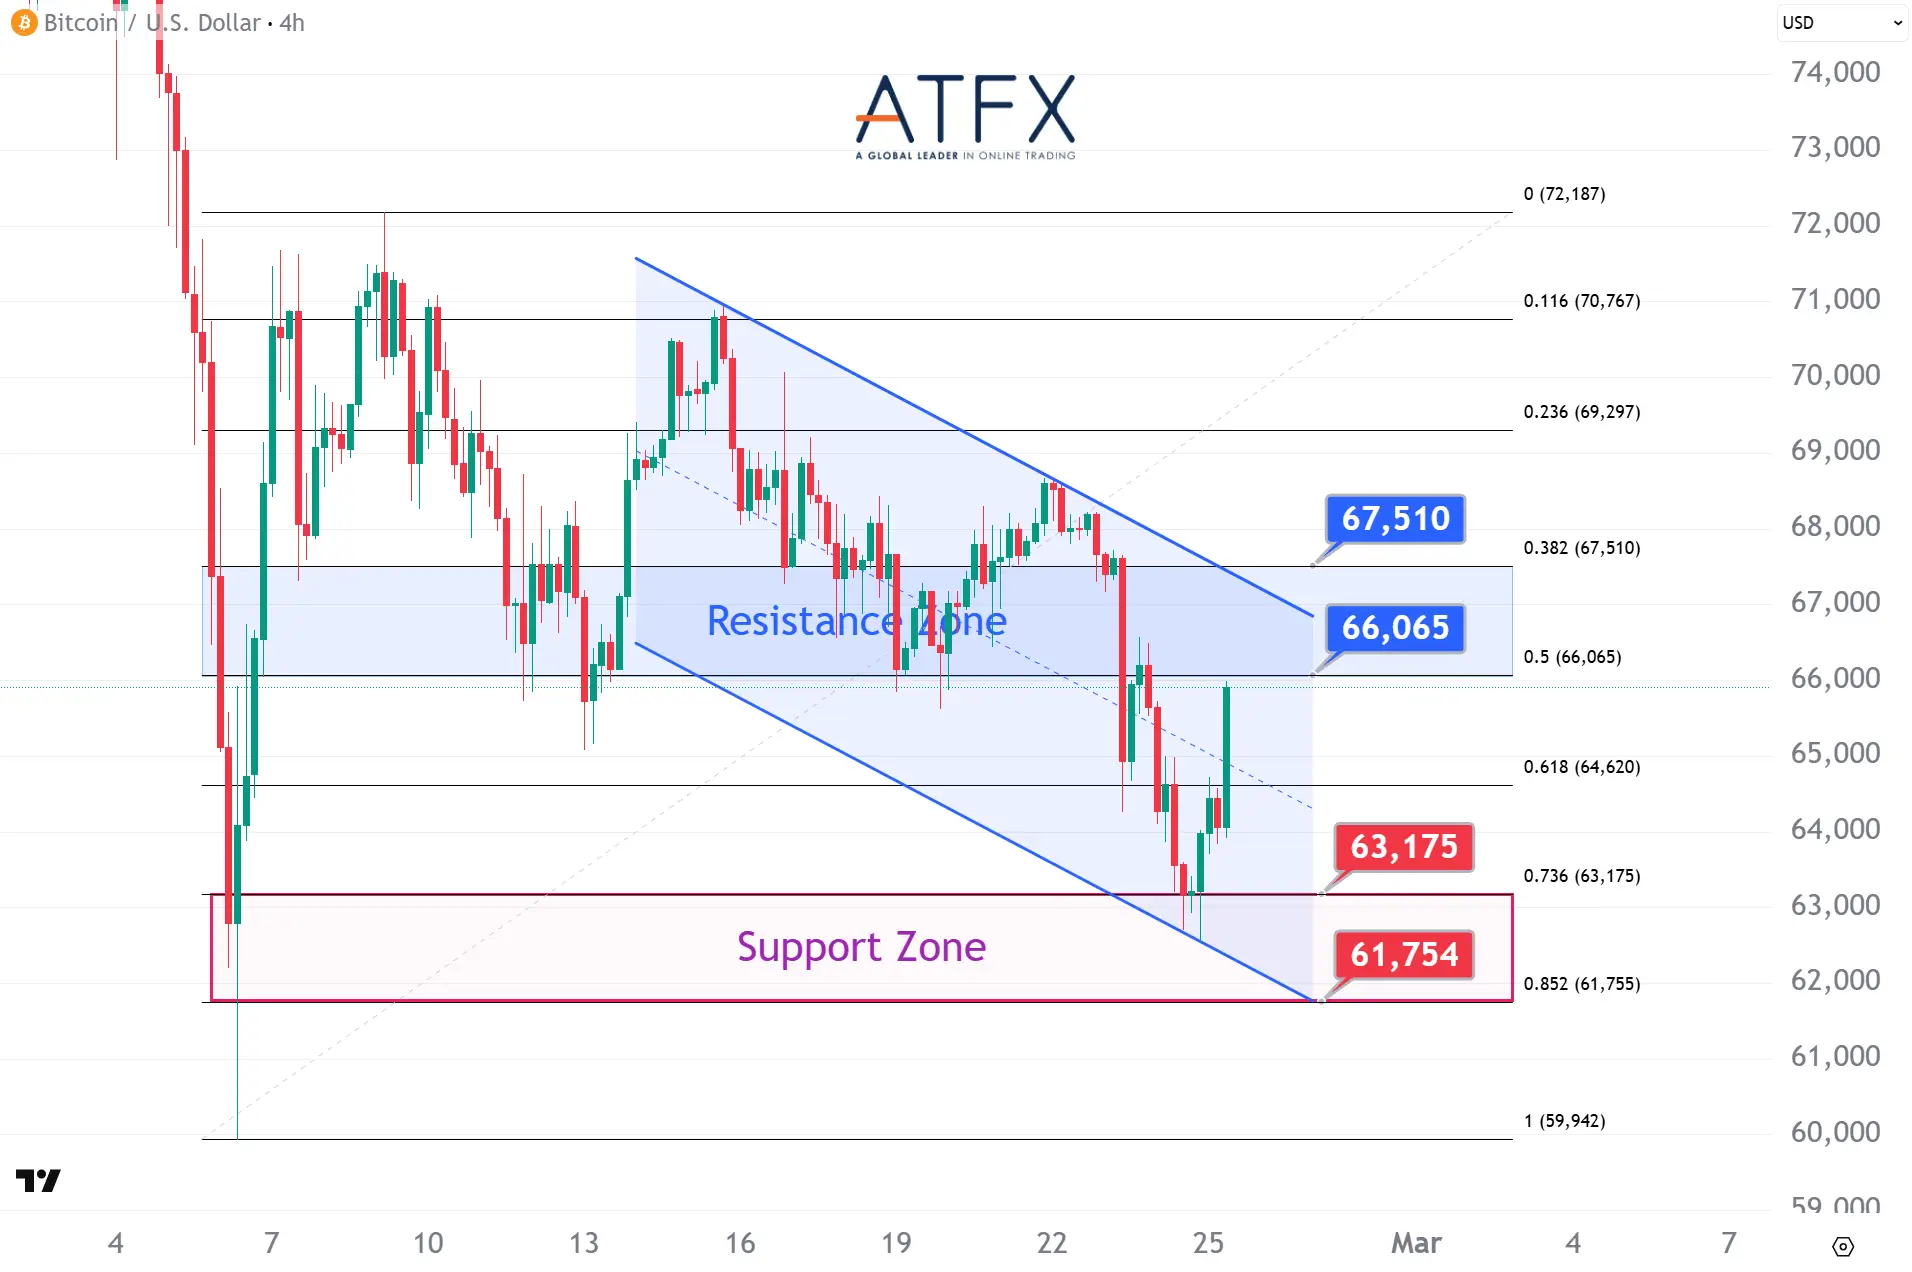
- Resistance: 66065/67510
- Support: 63175/61754
Bitcoin is consolidating within a descending channel, pressured by ETF outflows and whale activity. After retreating from its October peak, price action is testing the $61,754 – $63,175 support zone. A breakout above the $66,065 resistance (0.5 Fibonacci level) is essential to neutralize the current bearish momentum and stabilize the $60k–$72k range.
Enjoy trading! The content is for reference only. Please ensure that you understand the risk.