Key Takeaway for Traders
|
The Strait of Hormuz has become one of the most closely watched routes in global markets, with around one-fifth of global oil and liquefied natural gas (LNG) passing through a single narrow corridor. Even small changes in risk around this route are now enough to move oil prices and ripple through global markets.
What makes the current environment different from earlier oil shocks, such as the 1973 oil embargo or the 2022 energy price surge during global supply disruptions, is not just the disruption itself, but how markets respond to it. In the past, shocks were usually caused by sudden supply interruptions that eventually eased, allowing prices to settle back over time.
Today, the reaction is less predictable and more drawn out. Uncertainty about whether energy can continue to flow smoothly through key routes like the Strait of Hormuz means prices react more quickly and remain volatile for longer. As a result, market moves are driven less by traditional data such as interest rates and more by geopolitical risks that disrupt supply chains and transportation.
Key Routes in the Global Energy Trade
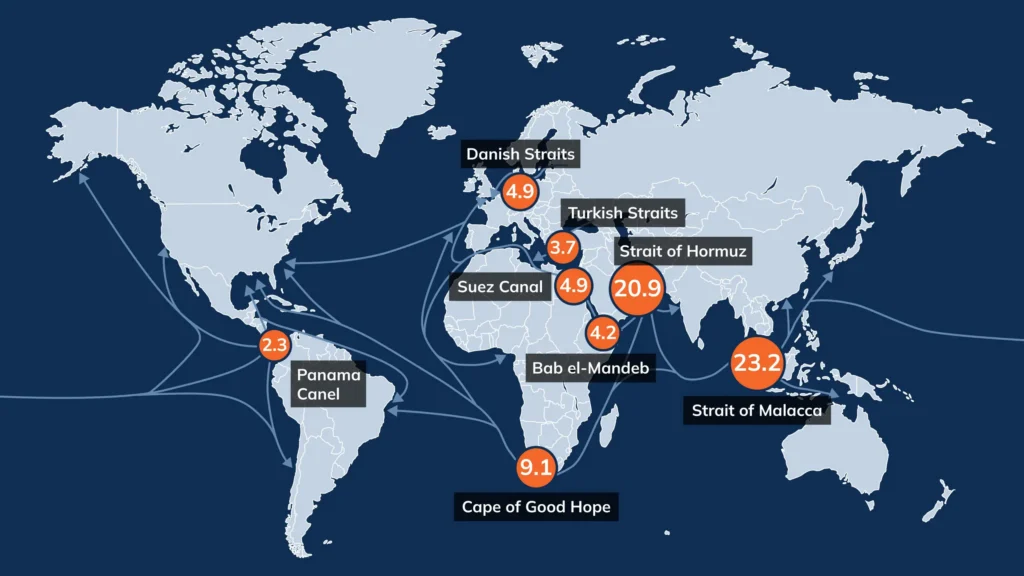
Source: U.S. Energy Information Administration (EIA), World Oil Transit Chokepoints (2026, 1H25 data). Figures shown in million barrels per day (mb/d).
To understand these market reactions, it helps to look at how global energy moves, as shown in the map above. Most of the world’s oil trade passes through a small number of narrow shipping routes known as chokepoints. These routes exist because there are limited practical alternatives for moving large volumes of energy across regions, linking Middle Eastern producers to global oil importers through a small number of key shipping routes.
Among these routes, the Strait of Hormuz and the Strait of Malacca are two of the most important global energy corridors. Rather than general transit routes, they function as critical chokepoints in global energy trade, with the Strait of Malacca serving as a major gateway to Asian markets. Even small changes in risk along either route can quickly feed through to shipping costs and energy pricing.
When pressure builds on these routes, trade does not stop, but it becomes more expensive and less efficient:
- Shipping is rerouted through longer paths, increasing travel time
- Fuel and freight costs rise as shipping capacity tightens
- Higher risk leads to increased insurance premiums
- Delivery schedules become less predictable, increasing uncertainty
These adjustments create what is often described as embedded inflation, where prices rise due to higher transport and logistics costs rather than stronger demand. As goods also become more expensive to move globally, the impact extends beyond energy, pushing up costs across supply chains, including agriculture and manufacturing.
How Different Regions Are Affected
The impact of disruptions in the Strait of Hormuz varies sharply across regions.
Major Import-Dependent Economies
Japan, South Korea, and China remain highly exposed to Middle Eastern energy flows but have stronger buffers than most import-dependent economies.
- Japan imports around 95% of its oil, with about 70% via the Strait, but holds approximately 254 days of reserves and diversified LNG supply, including imports from Australia
- South Korea relies heavily on Middle Eastern crude but maintains structured emergency storage systems
- China sources around 50% of its oil from the Gulf but holds the world’s largest strategic petroleum reserves
These buffers help smooth short-term shocks, but do not remove exposure to global oil price swings.
High-Sensitivity Economies
Economies such as India, along with parts of Southeast Asia (including the Philippines, Thailand, and Vietnam) and Africa, tend to experience faster pass-through into inflation and currency weakness when disruptions occur.
- India is highly sensitive to oil prices; a $10 rise typically worsens its import balance and pressures the rupee
- Southeast Asia (Philippines, Thailand, Vietnam) has smaller fuel buffers and limited government capacity to absorb shocks, leading to faster inflation effects
- In parts of Africa, heavy reliance on imported food and fuel, limited fiscal space, and weaker access to external financing make economies more vulnerable
The key risk is how quickly these effects feed through into the economy.
Market Impact and Trading Implications
This environment reshapes how major asset classes respond, with energy chokepoints acting as early signals of supply disruption. For traders, the first impact is usually seen in oil pricing before spreading into currencies and broader market sectors.
Commodities (Oil & Gas)
- Brent Crude Oil is highly sensitive to geopolitical risk, with pricing driven increasingly by transport and delivery uncertainty
- LNG is similarly vulnerable due to shipping and infrastructure constraints
In practice, oil and gas prices often move together in sharp “dual spikes” when shipping routes are threatened or blocked.
Broader Market Impact on Currency Markets
- The USD typically strengthens during periods of uncertainty as investors move into safe-haven assets
- Energy-importing economies such as Japan (JPY) and the Eurozone (EUR) tend to weaken as higher import costs weigh on trade balances
- Markets also diverge by sector, with energy, defence, and shipping outperforming due to higher prices and increased geopolitical demand, while airlines, travel, and consumer sectors lag as costs rise and demand weakens
Volatility has become a structural feature rather than a temporary phase. When physical supply routes are disrupted, price action is driven less by interest rates and more by logistics and energy flow constraints, with markets quickly repricing across multiple asset classes.
Possible Market Scenarios
Scenario 1: Stabilisation
If diplomatic progress reduces tensions and shipping routes normalise:
- Energy prices ease as geopolitical risk fades
- Volatility declines over time
Brent retraces as transport risks fade, while volatility remains sensitive to new developments.
🤔
What Traders May Look for
Attention may shift toward energy markets such as UKOil and USOil during normalisation, alongside stabilising major FX pairs and broader equity indices.
Scenario 2: Prolonged Disruption
In line with institutional scenarios:
- Oil remains elevated above historical averages.
- Inflation remains sticky and growth is revised lower.
Prices remain supported by transport and insurance costs, with continued pressure on demand and uneven regional pricing.
These market reactions are a common pattern across the most traded commodities globally, where supply and demand dynamics, influenced by geopolitical factors, can lead to significant price shifts.
🤔
What Traders May Look For
Attention typically remains on energy markets such as UKOil, USOil, defensive FX pairs like USDJPY, and inflation-sensitive assets such as gold (XAUUSD).
Scenario 3: Severe Escalation
A deeper disruption could lead to:
- Sharp spikes in oil prices and sharp declines in stock indices
- Coordinated energy stock releases and safe-haven demand.
Significant disruptions to supply routes would trigger broad market repricing, with limited ability for emergency releases to fully offset the shock.
🤔
What Traders May Look For
Safe-haven flows often concentrate in XAUUSD and USD, while volatility increases across major indices such as US500.
What This Means for Markets
Global markets are increasingly pricing risk based on the reliability of energy and goods movement, not just underlying supply conditions. Focus is shifting toward access, timing, and geopolitical stability, with disruptions feeding through global trade flows and financial conditions. As a result, shocks are becoming harder to absorb and slower to unwind, with volatility remaining a persistent rather than temporary feature.
Helping Traders Navigate Market Disruption
As markets become increasingly sensitive to disruptions in key energy routes such as the Strait of Hormuz, traders are facing faster price reactions across oil, currencies, and indices, making real-time monitoring of energy flows, geopolitical developments, and macro releases more important for understanding volatility and market direction. ATFX provides access to market news and analysis across oil, FX, and global indices, Trading Central tools for technical insights and trade support, and educational resources to strengthen trading knowledge, while the latest Trader Magazine Q2 edition offers deeper perspectives on energy markets, macro shifts, and the evolving global risk environment.
For deeper insights into the oil market, explore our oil market edition.