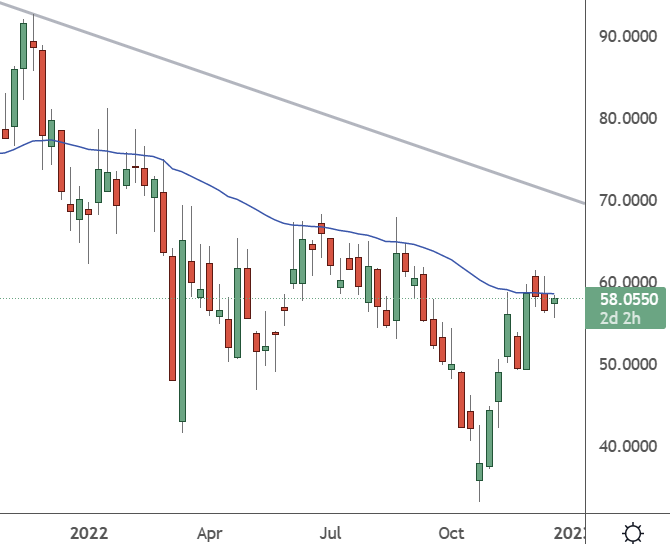
The shares of online retailer JD have been on a recovery path since the lows of early October.
With the bounce in Chinese stocks, the market is shrugging off a recent rise in Covid cases, which could be bullish as traders now look to the exit of the Zero Covid policy.
JD – Weekly Chart

JD trades at $58 on the Nasdaq, but a bullish week could see the stock push through the $60 mark to $70.
JD.com delivered solid Q3 2022 results despite a challenging macro environment in China which continued to be weighed by virus policies. As the Chinese government takes the first steps towards a gradual “reopening,” JD can look forward to a prosperous 2023.
There has been a lot of negativity surrounding Chinese stocks in 2022. Still, JD stock is on track to outperform US stocks this year- currently down around 15% versus a loss of almost 20% for the S&P.
In the most recent earnings results, JD’s September quarter was still pressured by the challenging economic outlook. However, the e-commerce giant posted strong results with total revenues of approximately $34.2 billion, higher than the $30.7 billion logged for the previous year and an 11.4% year-over-year increase.
Although analysts had expected revenues to be around $250 million higher, the company was able to shrug off the disappointment with a surprise jump in profitability. During Q3, JD recorded gross profits of $3.07 billion, representing a 27% year-over-year growth against the same period one year earlier. Adjusted net income was 4.5% higher year-over-year, at $1.4 billion. At the same time, EPS came in at 88 cents, which was 25 cents higher than the analyst consensus.
Goldman Sachs sees China’s economy expanding by 4.5% next year, while Morgan Stanley estimates GDP growth in 2023 at 5.4%. The analyst consensus for JD is a 15% year-over-year revenue growth to $173.84 billion, but that may be pessimistic.


