The vast majority of retail client accounts lose money when trading CFDs.
Important Notice - Fraud awareness
Important Notice - Scam alert
Spread bets and CFDs are complex instruments and come with a high risk of losing money rapidly due to leverage. The vast majority of retail client accounts lose money when trading CFDs. You should consider whether you can afford to take the high risk of losing your money.
Important Notice - Fraud awareness
Important Notice - Scam alert
The vast majority of retail investor accounts lose money when trading CFDs / Spread betting with this provider.
Spread bets and CFDs are complex instruments and come with a high risk of losing money rapidly due to leverage. The vast majority of retail investor accounts lose money when trading CFDs / Spread betting with this provider. You should consider whether you understand how CFDs / Spread betting work and whether you can afford to take the high risk of losing your money.
ATFX
Language
    ATFX-search-icon
    Client Portal
    Start trading
    rch

    How to Read Candlestick Charts For Beginners ? 4 Things You Should Know

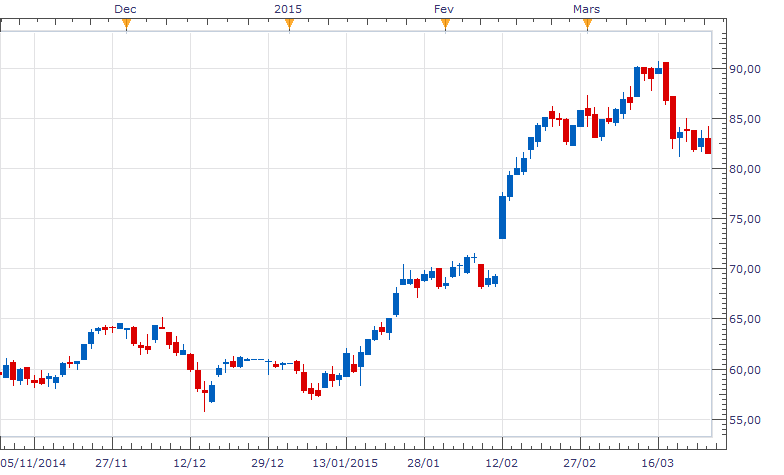
    What is a candlestick chart ?

    Candlestick chart is a way to show price data in the form of candlestick-looking units, each unit is put together and becomes the so-called “candlestick chart”. 

    This graphical representation is undoubtedly the most used by day-to-day traders as it provides much useful information, such as opening price, high price, low price, and closing price.

    Candlestick is also called “Japanese Candlestick” as it originated in Japan in the 16th century.

    how to read candlestick charts

    The chart may look complicated at first, but it's easy to understand, and we'll show you how to read them. 

    4 things to look at in the candlestick chat :

    1. Periods

      A candlestick corresponds to a period (in units of time). This period can be modified on the trading platforms according to your investment plan or strategies. Commonly, the time units used are m1 (one minute per candlestick), m5, m15, H1 (one hour per candlestick), H4, and D1 (one day per candlestick).

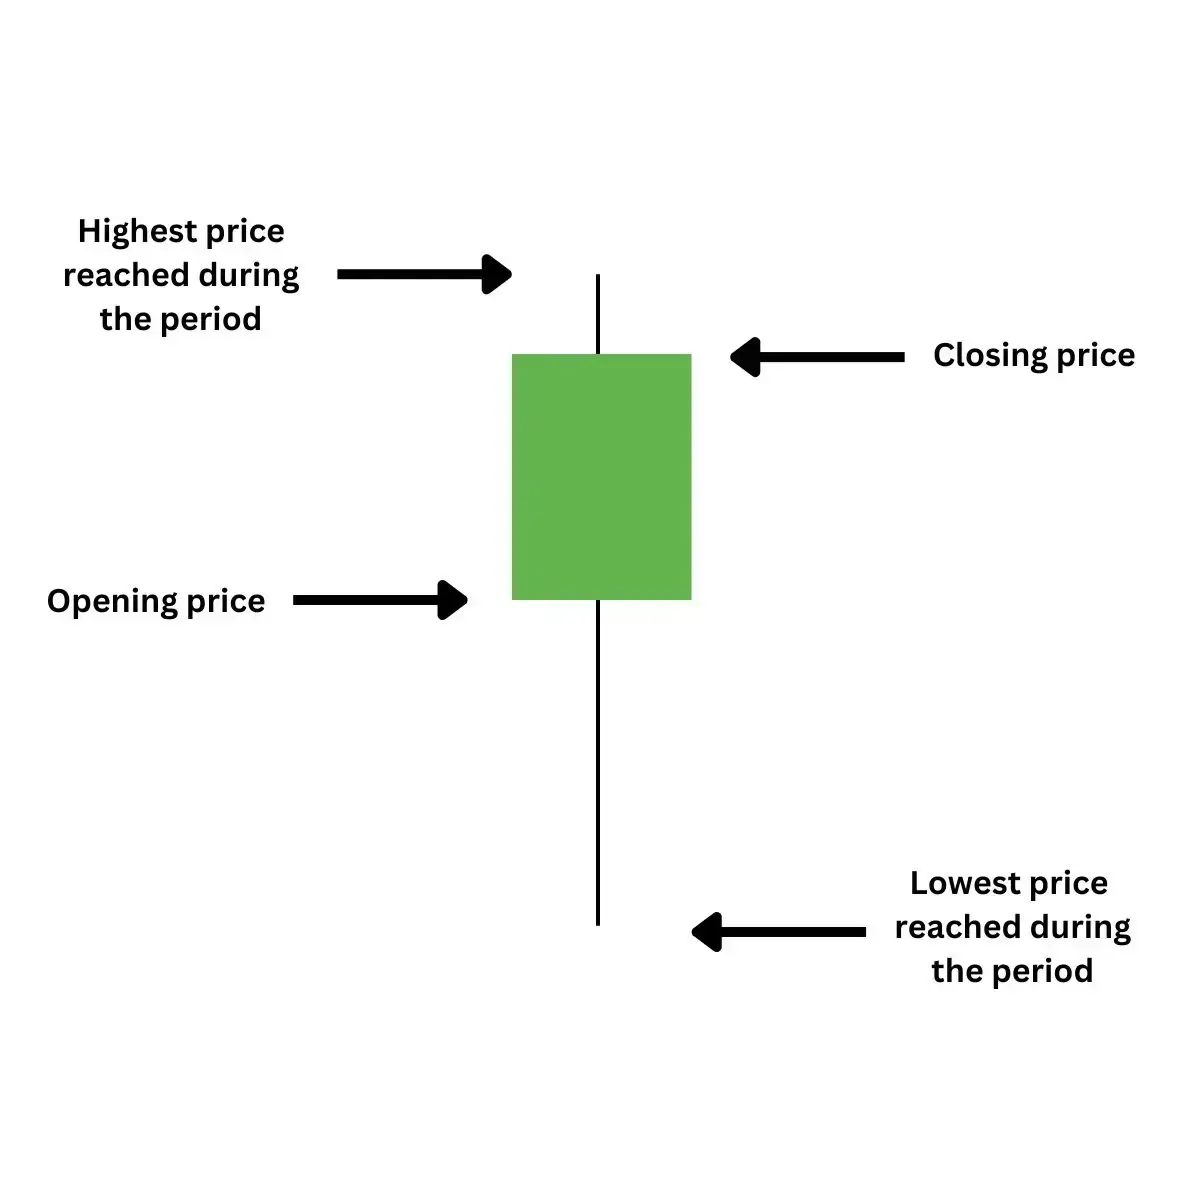
    2. The bullish candlestick (or rising candlestick)

      Often green or blue, the rising candlestick indicates that the price level at the end of the period is higher than at the beginning.

      bullish candlestick
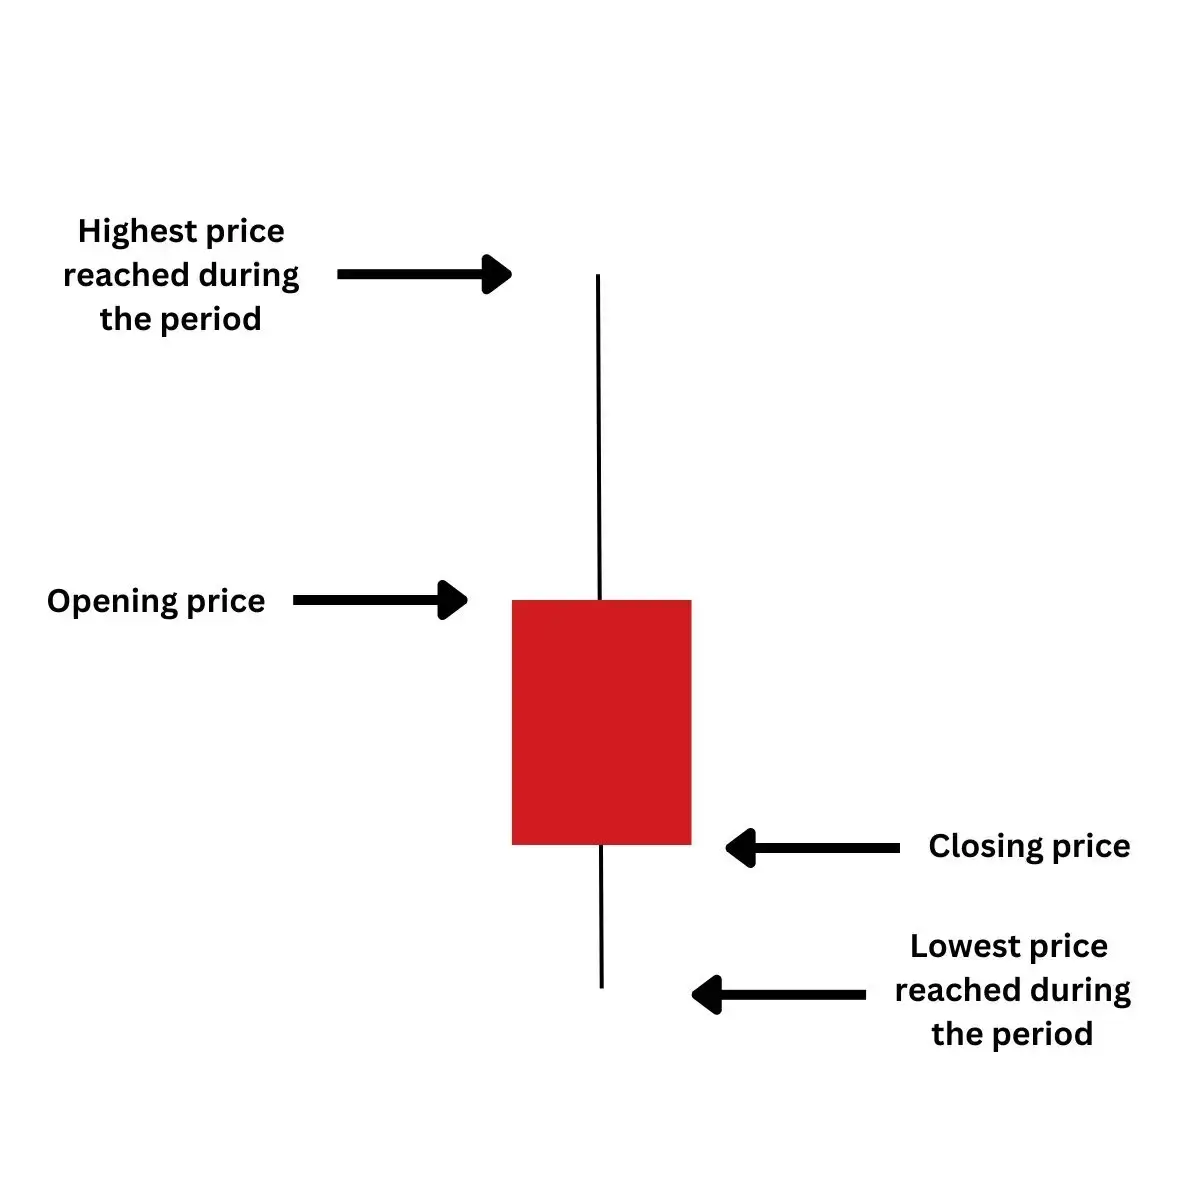
    3. The bearish candlestick (or falling candlestick)

      Often in red, the falling candlestick indicates that the price level at the end of the period is lower than at the beginning.

      bearish candlestick
    4. Formation of a candlestick

      The candlestick forms and evolves during its defined period. Below you will notice that the candlestick can go down or up in the same time frame. It is only at the end of the period that the candlestick will take its final form.

    candlestick

    Learn better with a demo account

    If you wish to improve your knowledge of candlestick charts before investing your hard-earned money, we suggest you open a demo account. ATFX offers all the major financial products on a solid trading platform to practice different strategies while still learning from a guide or the free training materials ATFX provides. So, get your demo trading account for free now ! 

    You may also be interested in learning how forex traders use candlestick charts to analyse market trends.

    Last Updated: 06/01/2023

    This market commentary and analysis has been prepared for ATFX by a third party for general information purposes only. Any view expressed does not constitute a personal recommendation or solicitation to buy or sell as it does not take into account your personal circumstances or objectives, and should therefore not be interpreted as financial, investment or other advice, or relied upon as such. You should therefore seek independent advice before making any investment decisions. This information has not been prepared in accordance with legal requirements designed to promote the independence of investment research and as such is considered to be a marketing communication. Although we are not specifically constrained from dealing ahead of our recommendations we do not seek to take advantage of them before they are provided to our clients. We aim to establish and maintain and operate effective organisational and administrative arrangements with a view to taking all reasonable steps to prevent conflicts of interest from constituting or giving rise to a material risk of damage to the interests of our clients. The market data is derived from independent sources believed to be reliable, however we make no representation or warranty of its accuracy or completeness, and accept no responsibility for any consequence of its use by recipients. Reproduction of this information, in whole or in part, is not permitted.


    Recent Posts

    Trading Strategies for Beginners
    What is Blockchain for Dummies: A Non-Techie's Guide to Cool Stuff

    Blockchain technology is a powerful tool that has the potential to revolutionize the way w...

    Trading Strategies for Beginners
    Swing Trading vs Day Trading: 8 Differences You Should Know in 2023

    Swing trading and day trading are two popular strategies traders use to profit from the fi...

    Trading Strategies for Intermediate Traders
    4 Types of Trading Chart Patterns | Why Is This Important?

    Chart trading patterns are tools used in technical analysis. Some traders will use indicat...

    Trading Strategies for Beginners
    How To Find Undervalued Stocks In 4 Easy Steps | Should You Buy It?

    What are undervalued stocks? Undervalued stocks are a type of stock trading at a price muc...

    Trading Strategies for Beginners
    How to Read Trading Chart ? 3 Most Used Trading Chart Types

    In this article, you will learn how to read a stock market chart, the absolutely essential...