GBP/USD
How to trade the GBP/USD Forex pair? Learn technical chart patterns including key drivers of currency exchange rates. Study GBP/USD live charts and begin to construct your own live technical analysis. Investigate and analyze historical data to better understand the relationship between GBP/USD prices and the foreign exchange market, followed with answers provided to frequently asked questions by GBP/USD traders.
GBP USD Live Chart
The live GBP USD exchange rate chart allows us to perform live technical analysis with popular technical indicators. Some of the more popular indicators are trend lines, which show whether the trend is upwards, downwards, or sideways. The MACD is mainly used to reflect market trends, such as bear or bull markets, while the RSI indicator (relative strength index) is used to determine when the price is oversold or overbought relative to the prevailing trend.
GBP/USD Forecast
Success in trading or investing in the British Pound against the US Dollar pair is largely dependent on the accuracy of one’s predictions of GBP USD prices through forecasting. One must first produce a forecast, then buy or sell (depending on one’s strategy) certain amounts of GBP USD currency before others do. Therefore, GBP USD trading and investing is to some extent an attempt to determine the true value of the GBP USD Forex pair from available prices, and to see if the Forex market agrees with one’s findings. It is equally important to have an exit strategy in place for situations in which one’s GBP USD forecast proves to be incorrect.
Two ways of knowing when to buy or sell
There are two main ways of trying to understand where GBP USD is going. The first school is called macroeconomic analysis and involves understanding the current economic, political, and monetary situation of the U.K. and the U.S.A, and investing in the currency of the country anticipated to outperform. Most of the time, people will focus on which country will have the highest interest rates, as it is the price of money e.g. the GBP or USD. Whilst sometimes investors focus more on economic growth outperformance, e.g. buy the currency of the country that has grown the strongest. The key interest of each country is thankfully linked to economic growth and inflation expectations, so there is a large overlap.
Some say that looking at the current country situation is enough as country dynamics change slowly, whilst other investors are only concerned with the future state of the respective economy, political, and monetary conditions. The truth is that both probably matter, present and future, and that helps to avoid focusing on obscure data or views that the general public will unlikely see.
The other major school is the focus on historical price patterns in the GBP USD, this school of thought is called technical analysis. Here, the general idea is to follow the GBP USD price trend and trade with it or try to figure out when the trend will reverse, or try to forecast when a trend will commence.
GBP/USD Long term Forecast
Both schools of thought are important, but if one is trying to determine the long-term forecast for the GBP/USD exchange rate, macroeconomics tends to be more reliable than technical analysis. This is because technical analysis focuses solely on past price movements and how they may repeat themselves. It does not take into account the factors that affect importers and exporters, investors, or central bankers. Macroeconomists, on the other hand, do consider these factors when making their long-term forecasts.
GBP/USD Short term Forecast
When attempting to forecast the GBP/USD exchange rate today or in the short term, technical analysis is the better option because it can provide exact price levels to manage positions. Macroeconomic analysis is useful for long-term direction, but it is terrible at pinpointing short-term price levels. This is why most macroeconomists have quarterly and annual price targets, as they do not know when the price will reach their objectives.
While macroeconomics is not the only factor to consider, short-term traders should still monitor the economic calendar as major macroeconomic events can occur almost every week and cause spikes in market volatility in the GBP USD.
GBP/USD Technical Analysis
There are various ways of trading with the help of technical analysis, so in this article, we will limit ourselves to one, very powerful trading pattern: the rectangle.
At its core, the rectangle pattern is when the GBP USD pair is trapped by a well-defined price floor, and a well-defined price ceiling, the former is called support, and the latter is called resistance. Say that the price of GBP USD bounces from 1.15 several times in May, and June, and is also capped by 1.17 in the same months. As you can see, the support comes in at 1.15 and that resistance is at 1.17. The difference between these two levels is 0.02.
If the GBP USD would trade below 1.15, then that would place all buyers in May and June at a loss, and they would probably close their position just below 1.15 to minimize their losses. This means that when the price trades below 1.15 the selling pressure will be higher than the buying pressure and the price will decline.
How much could the price decline? Per the rectangle pattern, the difference between the support level at 1.15, and the resistance at 1.17, is subtracted from the support level, which means that the price could reach 1.15 – 0.02 = 1.13, a drop of 200 pips. If the price would trade above 1.17, we would instead assume that the price would reach 1.19. Trading when the price breaks the support or resistance levels is called breakout trading and is probably the easiest way to trade as it is clear what one should do when the price breaches the range.
How to analyze the GBP/USD chart?
Now that you are familiar with the rectangle pattern, you can look for it in various time frames, such as the five-minute chart for short-term trading, or the four-hour or daily chart for longer-term trading. In general, the smaller the time frame, such as the five-minute chart, the higher the risk that the pattern will not work well. The same chart pattern on the daily GBP USD chart is probably the most reliable. With this knowledge, you now have a way to analyze the GBP USD chart.
GBP/USD Historical data
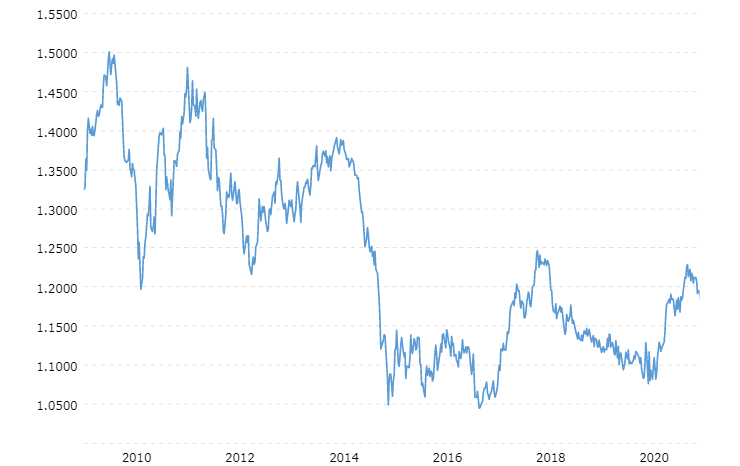
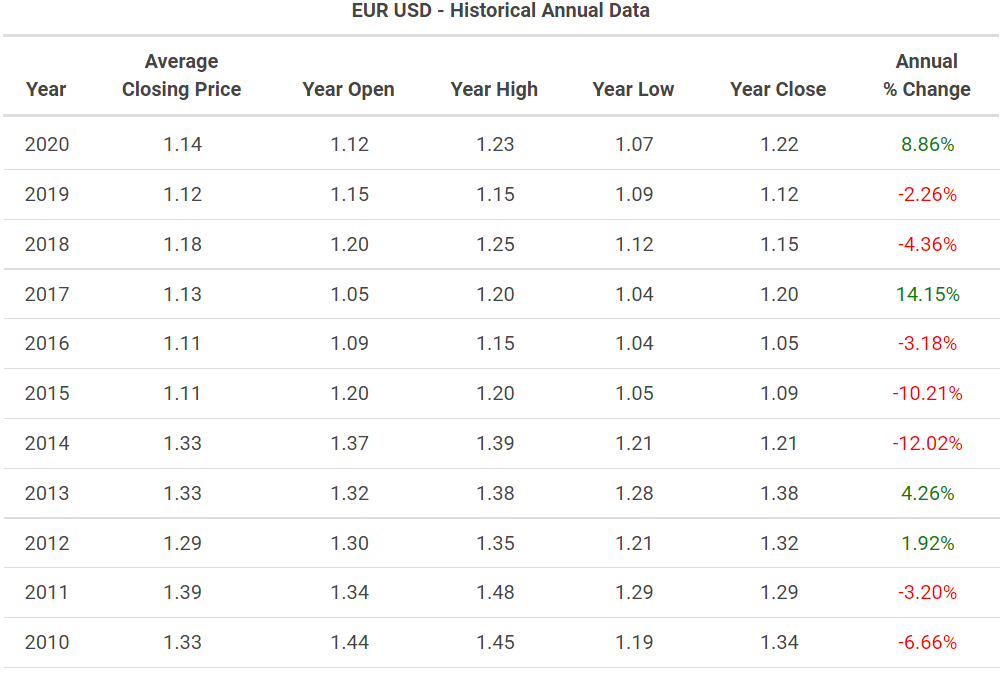
The GBP USD exchange rate history shows how the exchange rate between the British Pound, and US Dollar has evolved over time. Some people also call it “GBPUSDhistorical.”
We can use the data per the above table to perform technical analysis. We can see that the worst year since 2013 was in 2016, the GBP lost 16.05%, this was when the UK opted to leave the EU. Whilst the best year was in 2017 when the British Pound gained 9.51%, probably as a reaction to the prior year’s outsized loss. We, therefore, have a rough idea with the help of the data above what to expect from the GBP USD information of gains or losses.
What affects the GBP/USD exchange rate ?
Interest rates
The cost of borrowing or lending money is a key factor for currency traders. For example, if you have 100,000 to invest, would you deposit your money in a UK bank that pays a 3% return per year or in a US bank that pays 1% per year? Assuming there are no differences in the offers or risks of each bank, then the rational choice would be to place your 100,000 with the UK bank, as you will receive a higher return.
High interest rates are also a sign of strong economic growth or high inflation. While high economic growth is desirable, high inflation, which erodes the value of money, is not.
Economic growth
In a country with high economic growth, interest rates—the cost of borrowing money—tend to rise as the competition to borrow money increases. For instance, interest rates in the Eurozone have been low for a long time because economic opportunities for investment are low and inflation is low. However, in many emerging markets, where there are many opportunities to do business, more people will be interested in borrowing money, which will boost interest rates in that specific country.
High-interest rates attract money from investors who are looking to lock in high returns, as well as those who are looking to invest in the country.
Inflation
High inflation erodes the purchasing power of money, which can discourage investment. Conversely, high economic growth and high interest rates tend to attract capital flows, which boost the value of a currency.
Inflation, on the other hand, has the opposite effect. When investors consider investing in a country and its currency, they typically look at relative economic growth, inflation, and interest rates, and invest in the country with the best performance.
GBP/USD Trading Hours
GBP USD Forex market is open for trading between Sundays 17:00 EST and Fridays EST, by most brokers including ATFX. It is also possible to trade GBP USD over the weekend via cryptocurrency exchanges. However, very few people do as the liquidity is very poor, meaning that the cost of trading GBP USD over the weekend is very high. Also, because no important economic news is released over the weekend, there is little reason for GBP USD prices to change. Finally, because people know that there is no reason to trade over the weekend, very few people do it, instead, they take time off.
GBP/USD Trading Sessions
The Forex market for GBP USD currency trading hours begins from Sunday to Friday New York Time (EST). However, market activity for said Pound Dollar currency pair is not always high. Typically, most of the volume is executed within European business hours.
The Japanese banks usually wait until afternoon for London and Frankfurt to come online before making their exchanges, thus the London foreign exchange sees a lot of trade activity and is the busiest at this time. Around midday, London time, New York traders join as it is morning on the East coast and the highest amount of GBP USD is traded. After 17:00 London time, trading volumes have already started to dwindle. But trading remains open as the US traders are still at their desks and will be joined by Asia once more.
Trading adapted for high volatility
As trading is muted during the Asian trading session, most prices tend to remain in narrow price ranges. This means that GBP USD traders will do better using range bound trading strategies during the Asian session.
A range-bound GBP USD strategy means that we sell when the price reaches resistance and buy when the price reaches support levels. Also, because the price changes are small, people adapt and try to make many small profits. To make it profitable to make money on small price changes, brokers like ATFX offer leverage, that way a small percentage change can be multiplied, e.g. a 0.1% change can be turned to 1% change, 10% or higher. But at the same time, it is important to understand that high leverage could also hurt you if the price turns against you. This is the reason ATFX as a broker offers keen traders free courses and trading tools focussed on optimized control and risk management.
As the European business session tends to see the biggest trading we tend to see the break to the Asian trading ranges. For example, GBP USD might trade between 1.15 and 1.16 most of the Asian session, but as London and Frankfurt join the price will likely try to break the 1.15 support level and try to reach 1.14, or break 1.16 and try to reach 1.17.
Certain types of traders tend to find breakout trading appealing and therefore use breakout systems during this GBP USD trading session. A breakout strategy means that they buy when the price breaches a prior high, with the anticipation that the price will keep on gaining. If GBP USD breaks down, they will short-sell, that is to bet on the price to keep on dropping, when the price slides below support levels.
In summary, the European session is the most active trading session, and most see it as the best time to trade the GBP USD, but in the end, it depends on each person’s personality and trading strategy, but also the ability to trade. As an example, it would be hard for a Japanese trader to stay awake each night to trade the European session. The best months to trade GBP USD are non-summer months as market volatility tends to be low during the European summer. With ATFX you can trade Sunday to Friday and enjoy competitive spreads throughout all sessions.
How to trade or invest GBP USD like a pro?
3-Simple-Steps
1. Derive a trading strategy
If you trade the GBP USD pair in 2022, it is very important to have a trading strategy that works. A trading strategy will tell you when to buy and when to sell the GBP USD. It should also tell you when to book profits and when to book losses. You can also use it to know at what times one should trade the GBP USD, and when one should not trade the GBP USD. Spending time on developing this strategy will save you money, time and stress. You can also use a broker demo account to test it. But there is no better teacher than the real market because with a demo account you don’t feel the stress of trading. Also, in the end, we want to make real money so you would need to test it on a real market, with a real broker that offers a good trading platform. With real money feedback, we can continually tweak the strategy.
2. Derive an optimal betting strategy
Having a trading strategy is not enough, we also need to figure out how much to risk per trade to ensure we do not run out of money before the GBP USD trading strategy delivers. Running out of money is a typical issue as new traders like to bet big. Whilst most professionals will never risk more than 1.5% of their capital per trade. A good trading platform will help you quickly calculate your risk per trade.
3. Implement and stick to your trading strategy
Another common issue is that people will struggle to follow their plans and change from one trading system to another. People will usually do this because they do not trust their own strategy. The best way to build trust is to research your GBP USD strategy properly, and trade it with real trades, but with low risk. At the start, one can trade with a demo account. But trading with real money tends to save years as it forces people to make quick decisions.
Why trade GBP USD with ATFX?
Competitive Spreads
24/5 Forex Trading
Trade 40+ Currency Pairs
FAQ
It is the exchange rate between the British Pound and the US Dollar.
The Norwegian Krone is the world’s strongest currency.
GBP SGD (GBP vs. Singaporean dollar) has a high correlation to GBP USD.
This depends on where interest rates, inflation, and economic growth is the highest, as it stands in late 2021, it looks like the GBP USD rate trends lower as the US economy outperforms the UK.
The GBP SGD, USD CNH, and USD CZK.
Trading in GBP USD starts with most brokers on Sundays at 17:00 EST (New York time) and ends on Friday’s at 17:00 EST.
That is a signal (indication) to buy or sell the GBP USD. Signals are usually issued by independent traders via social media.
It depends on the relative performance of the UK vs. US economies.
In the 1930s the GBP USD rate reached briefly above 5 dollars per pound. But since then the exchange rate has declined as the influence of the UK economy and the country as a superpower has declined. Instead, the USA has risen as a superpower.
You would need to multiply your lot size with the exchange rate. There are three typical lot sizes: 1000 units, 10,000 units, and 100,000 units.
COT stands for “Commitments of Traders” and it is a weekly report showing how traders of GBP USD futures are positioned.
This is the GBP USD exchange rate vs. the price of gold.
Say that GBP USD trades from 1.1510 to 1.1511 then you have made one pip in profit. If you bought 10,000 GBP vs. the USD at the above-mentioned prices then you would have made 1 USD, because 10,000 x 1.1511 = 11511, and 10,000 x 1.1510 = 11510, and $11511 – $11510 = 1 USD.
To be able to make money trading GBP USD we need to have market volatility, this means that there are price movements. Traditionally, summers will be quiet as traders are on holiday so avoid June, July, and August if you would like to avoid months with low market volatility.
The best time to trade EUR/USD is when news releases come out or when economic indicators come out and when a major central bank decision is anticipated. You will find volatility increases during these hours. The busiest time zone is between New York and London by volume.