US Dollar Slumps After NFPs Miss Expectations, US Equities Bid
A sharp move lower in the US dollar after the latest US Jobs Report is being retracted. Concerns that US inflation will remain elevated continue to dominate USD price action. The latest US ISM services release showed US growth slowing while prices increased. The services PMI fell to its lowest level in two years, while prices paid jumped to a three-month high.
A lack of notable EU data releases or events next week will leave the Euro vulnerable to moves in other currencies. In the UK, the Bank of England will announce its latest policy decision on Thursday, 10th, at noon UK time, with all policy dials expected to be untouched. There may be a shift in voting patterns, with more members voting for a rate cut, which would weaken the British Pound. The BoE will also release its latest Quarterly Inflation and Growth reports.
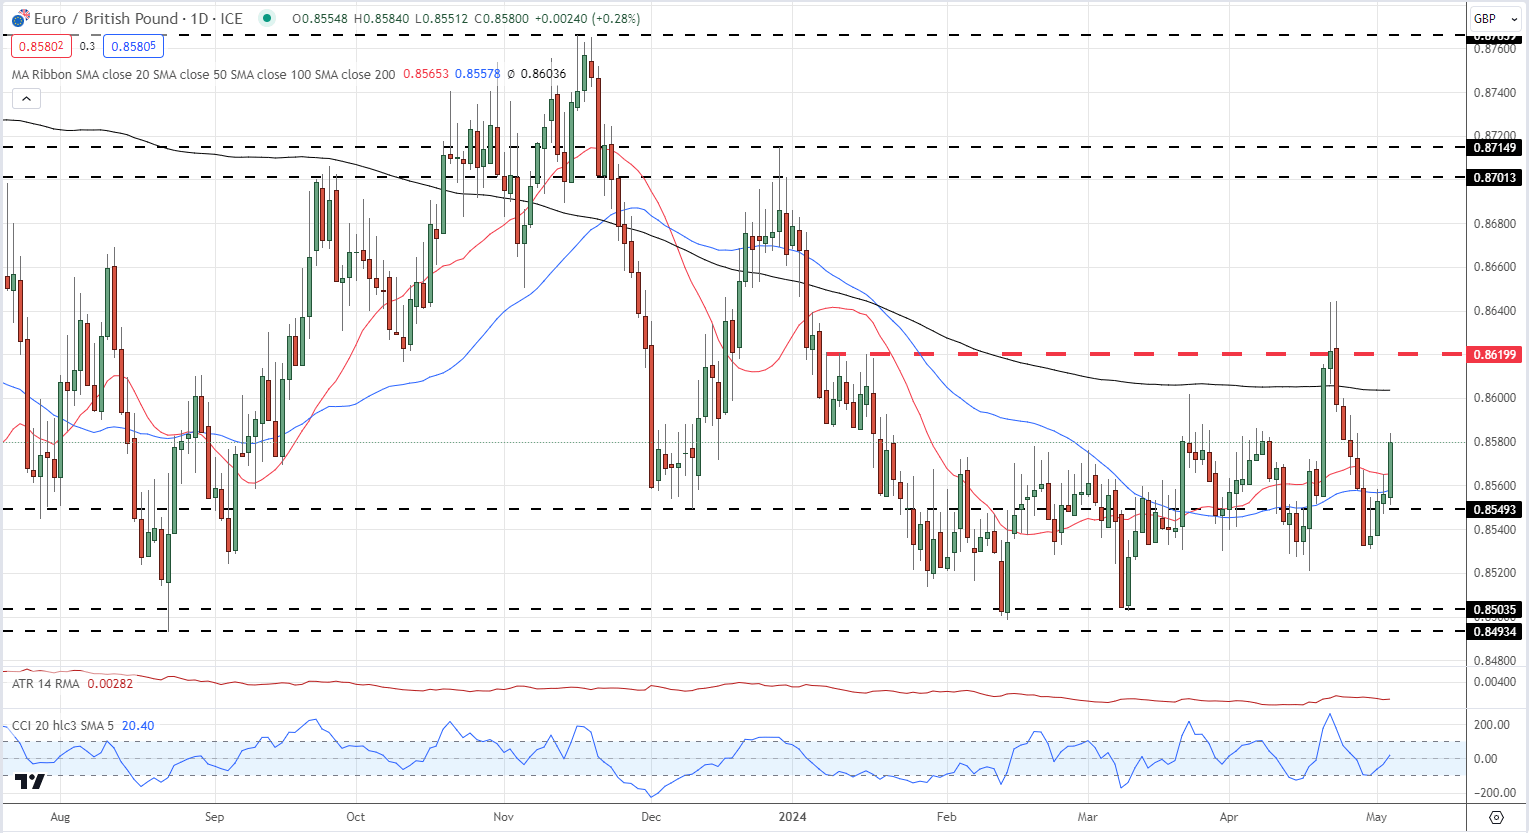
This week, EUR/GBP has pulled back some of its recent losses and broken back above the 20- and 50-day simple moving averages. The next resistance level is at 0.86 before the 200-day SMA comes into play at 0.8603. Above here, 0.8620 and 0.8645 are supported. A move lower sees support at 0.8550 and 0.8520.
EUR/GBP DAILY PRICE CHART

The US economic calendar is also light next week. However, markets can expect a flurry of Federal Reserve speakers after this week’s FOMC decision and NFP release. Interest rate differentials between the Euro and the US dollar will continue to be watched closely, and the ECB is fully expected to start cutting rates at the June policy meeting.
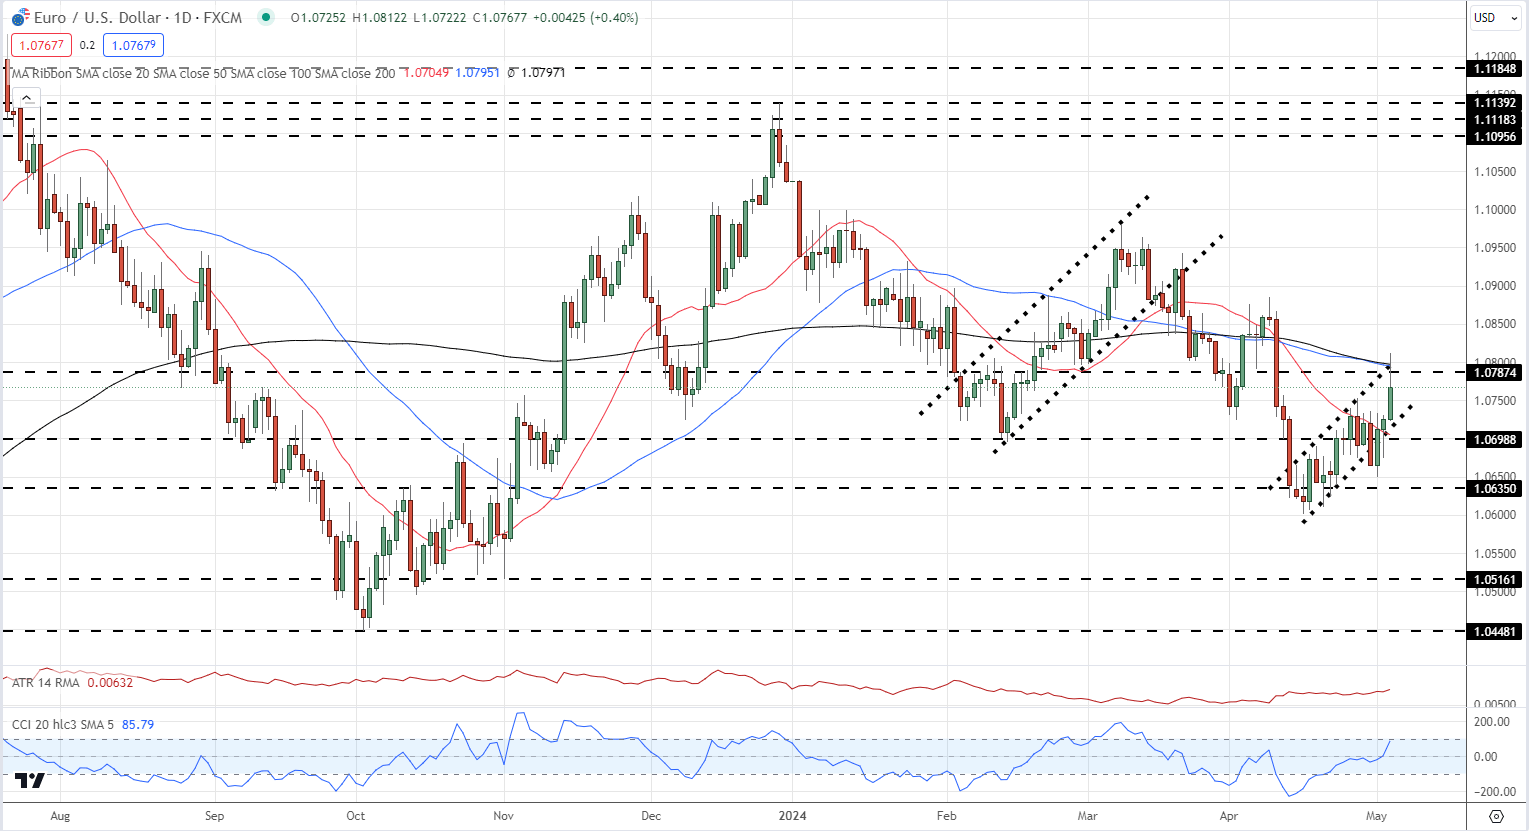
EUR/USD remains within an upward trending channel, but this could quickly turn into a negative bear flag if the pair breaks trend support. A longer-term trend of lower highs and lower lows is still in place, with a break below 1.06 seen as the next negative signal. Before then, trend support, the 20-day sma, and a prior swing low of around 1.07 will act as first-line support. Rallies will find initial resistance between 1.0780 and 1.0795 before a gap up to 1.0885.
EUR/USD DAILY PRICE CHART

Retail trader data shows 47.54% of traders are net-long, with the ratio of traders short to long at 1.10 to 1. The number of traders net-long is 9.02% lower than yesterday and 5.35% lower than last week. In comparison, the number of traders net-short is 18.22% higher than yesterday and 17.35% higher than last week.


