Las apuestas por diferencias y los CFD son instrumentos complejos y conllevan un alto riesgo de perder dinero rápidamente debido al apalancamiento.
La gran mayoría de las cuentas de clientes minoristas pierden dinero cuando operan con CFDs.
Debe considerar si puede permitirse asumir el alto riesgo de perder su dinero.

¿Cómo leer los gráficos? Los 3 tipos de gráficos más utilizados

En este artículo, aprenderá a leer un gráfico bursátil, el paso absolutamente esencial para empezar a construir sus propios análisis de cualquier activo que desee analizar (acciones, índices, materias primas, divisas).

Le informaremos sobre las 3 formas de leer gráficos bursátiles:

  1. Gráfico lineal 

Es la representación más sencilla. En esta representación, cada punto corresponde al precio de cierre. Los puntos colocados uno tras otro forman líneas que a su vez forman curvas.

A pesar de su sencillez, este tipo de gráfico es poco utilizado por los operadores. De hecho, al estudiar los demás tipos de gráficos veremos que éste carece de información suficiente para realizar un análisis pertinente (ejemplo: GAP, puntos bajos y altos del periodo, etc.).

line chart

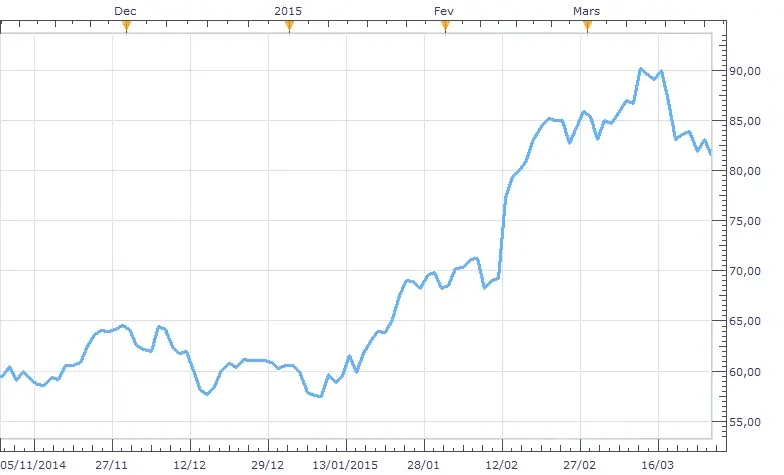
Aún así, es necesario saber que este tipo de gráfico suele ser utilizado por los medios de comunicación o determinadas plataformas independientes.

  1. Gráficos de barras

Aquí tenemos varillas formadas por líneas horizontales y pequeñas líneas verticales. También vemos que cada varilla corresponde a un periodo (aquí en días).

Por otra parte, gracias a estos gráficos de barras, tenemos mucha más información sobre el periodo considerado. En efecto, estas barras nos permiten conocer los precios de apertura y cierre y los mínimos y máximos alcanzados en el periodo. Por lo tanto, tenemos una mejor visibilidad de toda la amplitud del periodo.

bar chart annotation

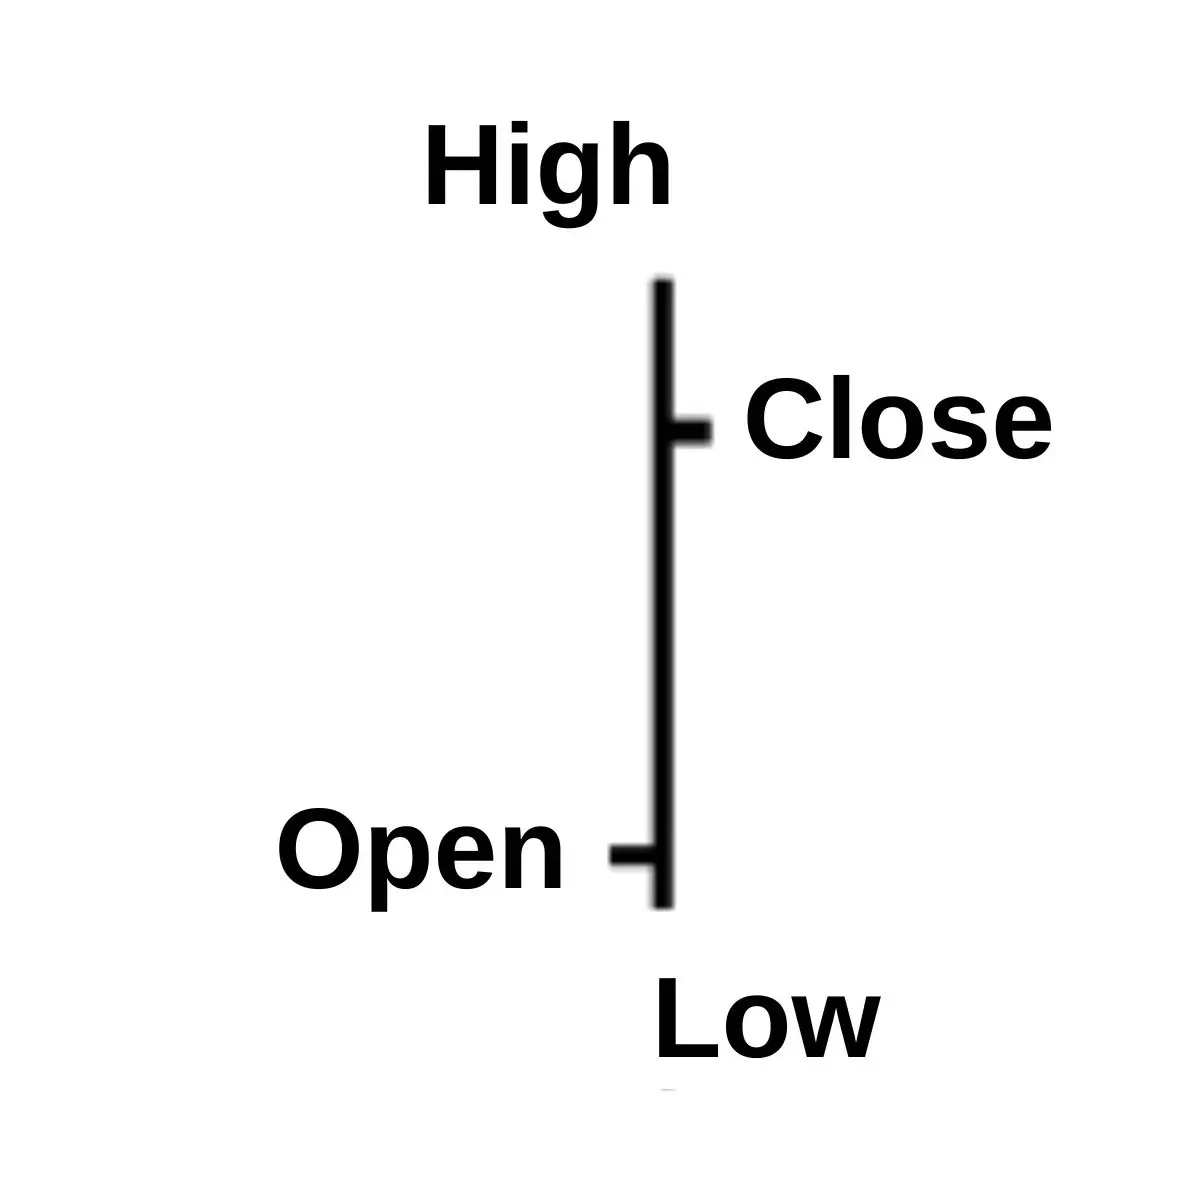
Una barra alcista (el precio de cierre es superior al de apertura) suele ser de color azul o negro. Por el contrario, una barra bajista se caracteriza por una barra de color rojo o negro.

bar chart

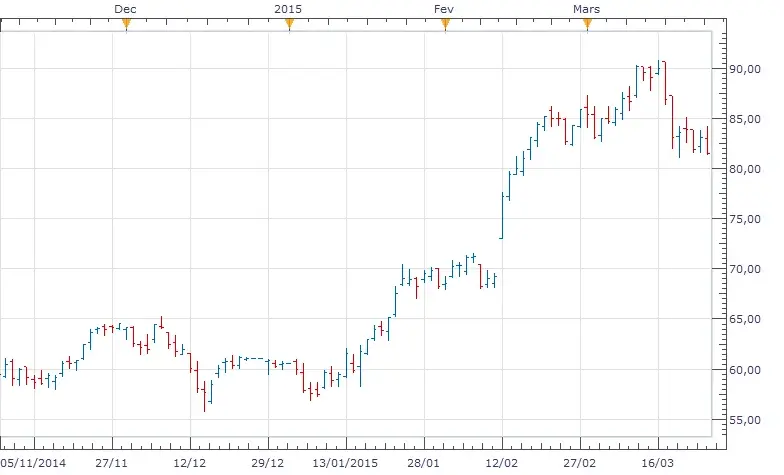
Los operadores utilizan más esta representación gráfica porque, como habrá observado, es mucho más completa.

  1. Gráfico de velas (también llamado gráfico de velas japonesas)

Como ya hemos escrito un artículo sobre este tema, le sugerimos que lo consulte. En concreto, explicamos cómo entender fácilmente el gráfico de velas y tomar mejores decisiones de trading. Aprenda a leer los gráficos de velas.

Mientras tanto, si desea poner a prueba sus conocimientos sobre los gráficos de velas antes de invertir el dinero que tanto le ha costado ganar, le sugerimos que abra una cuenta de demostración. ATFX ofrece todos los principales productos financieros en una sólida plataforma de negociación para practicar diferentes estrategias sin dejar de aprender de una guía o de los materiales de formación gratuitos que ATFX proporciona. Por lo tanto, ¡abra ahora su cuenta de demostración gratuita! 

Noticias recientes
¡Empiece a operar ahora!
Pruebe nuestra cuenta demo de forma gratuita para aprender a operar. Cuando esté a punto, cambie a una cuenta real y comience a operar de verdad.
Popular posts
ATFX

Restrictions on Use

Products and Services on this website are not suitable for the UK residents. Such information and materials should not be regarded as or constitute a distribution, an offer, or a solicitation to buy or sell any investments. Please visit https://www.atfx.com/ar/ to proceed.
ATFX

Restrictions on Use

Products and Services on this website are not suitable for the UK residents. Such information and materials should not be regarded as or constitute a distribution, an offer, or a solicitation to buy or sell any investments. Please visit https://www.atfx.com/en/ to proceed.

ATFX

Restrictions on Use

Products and Services on this website are not suitable for the UK residents. Such information and materials should not be regarded as or constitute a distribution, an offer, or a solicitation to buy or sell any investments. Please visit https://atfxgm.eu/en/ to proceed.

ATFX

Restrictions on Use

Products and Services on this website are not suitable for the UK residents. Such information and materials should not be regarded as or constitute a distribution, an offer, or a solicitation to buy or sell any investments. Please visit https://www.atfx.com/en-au/ to proceed.

ATFX

Restrictions on Use

Products and Services on this website are not suitable for the UK residents. Such information and materials should not be regarded as or constitute a distribution, an offer, or a solicitation to buy or sell any investments. Please visit https://www.atfx.com/ar/ to proceed.
ATFX

Restrictions on Use

Products and Services on this website are not suitable for the UK residents. Such information and materials should not be regarded as or constitute a distribution, an offer, or a solicitation to buy or sell any investments. Please visit https://www.atfx.com/en/ to proceed.

ATFX

Restrictions on Use

Products and Services on this website are not suitable for the UK residents. Such information and materials should not be regarded as or constitute a distribution, an offer, or a solicitation to buy or sell any investments. Please visit https://www.atfx.com/en-za/ to proceed.
ATFX

Restrictions on Use

Products and Services on this website are not suitable for Hong Kong residents. Such information and materials should not be regarded as or constitute a distribution, an offer, solicitation to buy or sell any investments.

使用限制: 本網站的產品及服務不適合香港居民使用。網站內部的信息和素材不應被視為分銷,要約,買入或賣出任何投資產品。

ATFX

Restrictions on Use

Products and Services on this website are not suitable for the UK residents. Such information and materials should not be regarded as or constitute a distribution, an offer, or a solicitation to buy or sell any investments. Please visit https://atfxgm.eu/en/ to proceed.

ATFX

Restrictions on Use

AT Global Markets (UK) Limited does not offer trading services to retail clients.
If you are a professional client, please visit https://atfxconnect.com