


Key Takeaways
|
Financial markets rarely move in isolation. Changes in inflation expectations, central bank policy, or unexpected geopolitical events can quickly ripple across currencies, commodities, precious metals, and equities as investors adjust their positions.
For traders, understanding these connections has become increasingly important. The focus is no longer only on whether a single market will rise or fall, but on a broader question – where is capital flowing, and what does that signal about the next phase of the market?
During periods of stronger growth, capital often flows into equity indices, commodities, and higher-yielding currencies, while uncertainty drives it into safe-haven assets such as the US dollar, Japanese yen, gold, and government bonds. These shifts rarely happen all at once, and staggered reactions across markets can provide early clues about changes in sentiment and positioning.
How Market Conditions and Risk Sentiment Shape Capital Flows
Capital flows shift as investors respond to changing inflation expectations, interest-rate outlooks, liquidity conditions, and geopolitical developments. While every market cycle is different, market behaviour often falls into several broad conditions.
a) Periods of Market Uncertainty
During periods of uncertainty, investors often prioritise capital preservation and liquidity. Common safe-haven assets include:
- US dollar
- Japanese yen
- Gold
Safe-haven behaviour has also evolved, with investors increasingly spreading capital across multiple assets rather than concentrating on a single asset.
b) Inflation and Supply-Driven Markets
Inflation shocks and supply disruptions can create different market dynamics, often resulting in:
- Rising commodity prices
- Increased focus on energy and raw materials
- Shifting expectations around inflation and monetary policy
These shocks can quickly affect broader market sentiment.
c) Periods of Strong Risk Appetite
When confidence improves, investors often become more willing to take on risk. Assets that may benefit include:
- Major equity indices
- Emerging-market assets
- Higher-yielding currencies
- Growth-oriented sectors
Even in stronger market conditions, performance is not evenly spread, with some sectors and regions outperforming others. Understanding the current market environment can help traders see which assets are leading and which may react later.
When Market Correlations Break Down
One important lesson from recent market cycles is that market correlations should not be treated as a guarantee. Gold and the US dollar, for example, are often expected to move in opposite directions. This is because a stronger US dollar makes gold more expensive for buyers using other currencies, which can put pressure on gold prices.
However, this is not always the case. As shown in Figure 1, the 2022–2023 period generally followed this pattern, with a stronger US dollar and weaker gold prices. But from 2024 onwards, the relationship changed. Gold rose sharply even as the US dollar remained fairly strong. Instead of moving in opposite directions, the two sometimes moved separately.
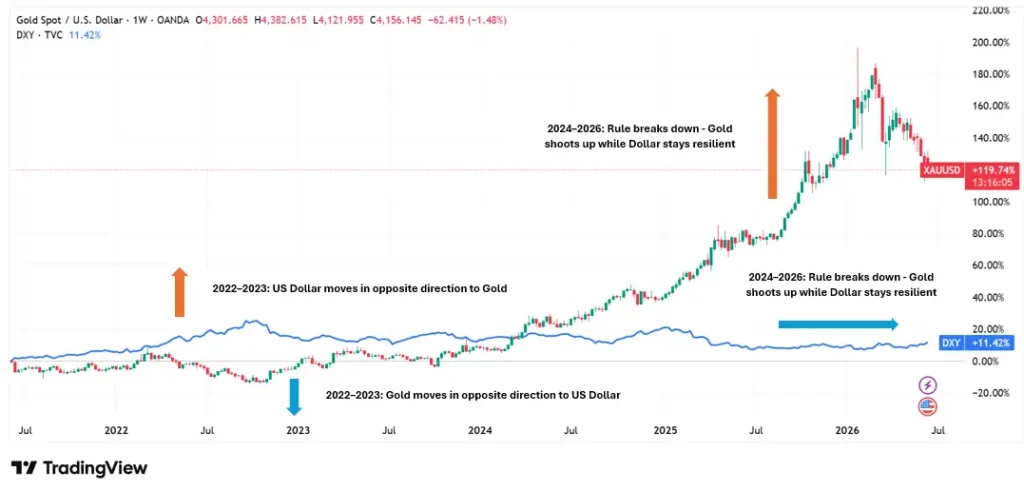
Figure 1: Gold (XAUUSD) – US Dollar Index (DXY) chart showing how their usual inverse relationship has shifted
This divergence highlights that market relationships can change depending on broader economic and political conditions. In particular, gold can behave differently when driven by factors such as central bank buying, persistent inflation concerns, or heightened geopolitical uncertainty, which can override traditional currency-based dynamics.
Early Signals of FX Capital Flows
Foreign exchange (FX) markets are among the biggest and most active markets in the world. Because of this, they often react quickly to changes in the economy. FX moves often provide early signals of changes in growth, inflation, and interest rate expectations.
For example, USDJPY reflects policy differences between the US Federal Reserve and the Bank of Japan and is often used to gauge global liquidity conditions. As shown in Figure 2, movements in USD/JPY closely track changes in the yield difference between US 10-year and Japanese 10-year government bonds. When the gap is large, investors are more willing to borrow in Japan and invest in US assets. When it is smaller, this becomes less attractive.
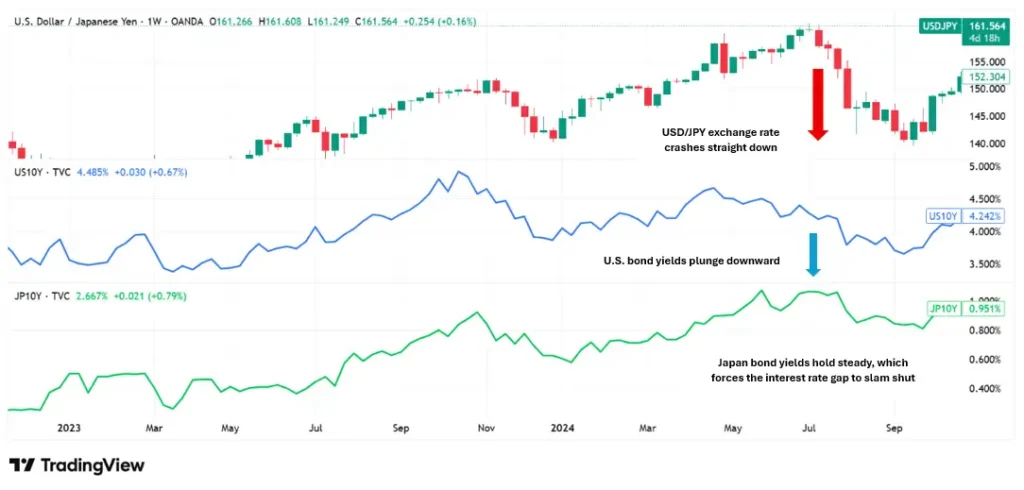
Figure 2: USDJPY compared to US–Japan yield difference (2023–2024)
The yield gap widened in 2023 as US yields rose while Japanese yields stayed low. This supported USD/JPY and made carry trades more attractive because investors could earn more by holding US assets with borrowed yen.
In 2024, the gap narrowed as US yields stopped rising and Japanese yields slowly increased. As a result, USD/JPY lost strength and moved lower as carry trades became less attractive.
This shows a simple link in global markets. When yield gaps move, funding conditions also change, because the cost and return of borrowing between currencies shift. This affects carry trades and FX positioning. When changes are gradual, currencies tend to move smoothly. When changes are fast, FX often moves sharply as traders reduce risk.
A Framework for Identifying Cross-Asset Opportunities
Although markets are complex, traders can use a structured approach to understand capital flows and how different asset classes respond to market events.
- Step 1: Identify the Trigger
Determine the key driver of the market move. This could be an inflation surprise, central bank decision, geopolitical event, or supply disruption. Different triggers tend to produce different transmission patterns across asset classes.
- Step 2: Identify Which Market Reacts First
Observe which market responds first. This may appear in currencies, bond yields, gold, or commodities. The first reaction often provides insight into where the market is repricing expectations.
- Step 3: Look for Cross-Asset Confirmation
Assess whether other asset classes begin to reflect the same narrative. Broader alignment across markets can indicate that capital rotation is becoming more established.
Markets rarely adjust at the same time. Instead, price changes usually appear in stages, starting in one market and then spreading to others.
Applying Cross-Asset Analysis on MT4 and MT5
For traders using MT4 and MT5, monitoring related markets can help identify changes in positioning across different asset classes.
A practical cross-asset watchlist may include:
- Gold (XAUUSD) – to track defensive positioning and demand for safe-haven assets
- USD/JPY and the US Dollar Index (DXY) – to observe changes in USD strength and yield-related flows
- Brent crude oil – to monitor shifts in inflation pressure and global activity
- Indices – to gauge overall equity market performance
The objective is not to forecast the exact price direction. Instead, traders can observe whether related markets are moving in the same direction or reacting differently. Differences in movement across asset classes can signal that pricing is adjusting at different speeds across markets.
How ATFX Supports Traders in a Cross-Asset Trading Environment
Modern markets are increasingly shaped by capital flows across asset classes, where currencies, commodities, and indices can respond differently depending on broader macroeconomic conditions. In this environment, no single trading approach is effective in all situations. Manual trading offers flexibility and context; automated systems provide structure and consistency; and data-driven and AI tools can help process large amounts of information, including price action, news, and macro signals.
Within this evolving landscape, ATFX provides access to real-time market news and analysis across major asset classes, supported by Trading Central tools and educational resources designed to help traders navigate different market conditions. Traders can also stay updated through ATFX’s Trader Magazine, which covers key themes such as global capital flows, energy markets, macroeconomic shifts, and broader risk trends.